Week 1
What is in a data model
Problem with relational models
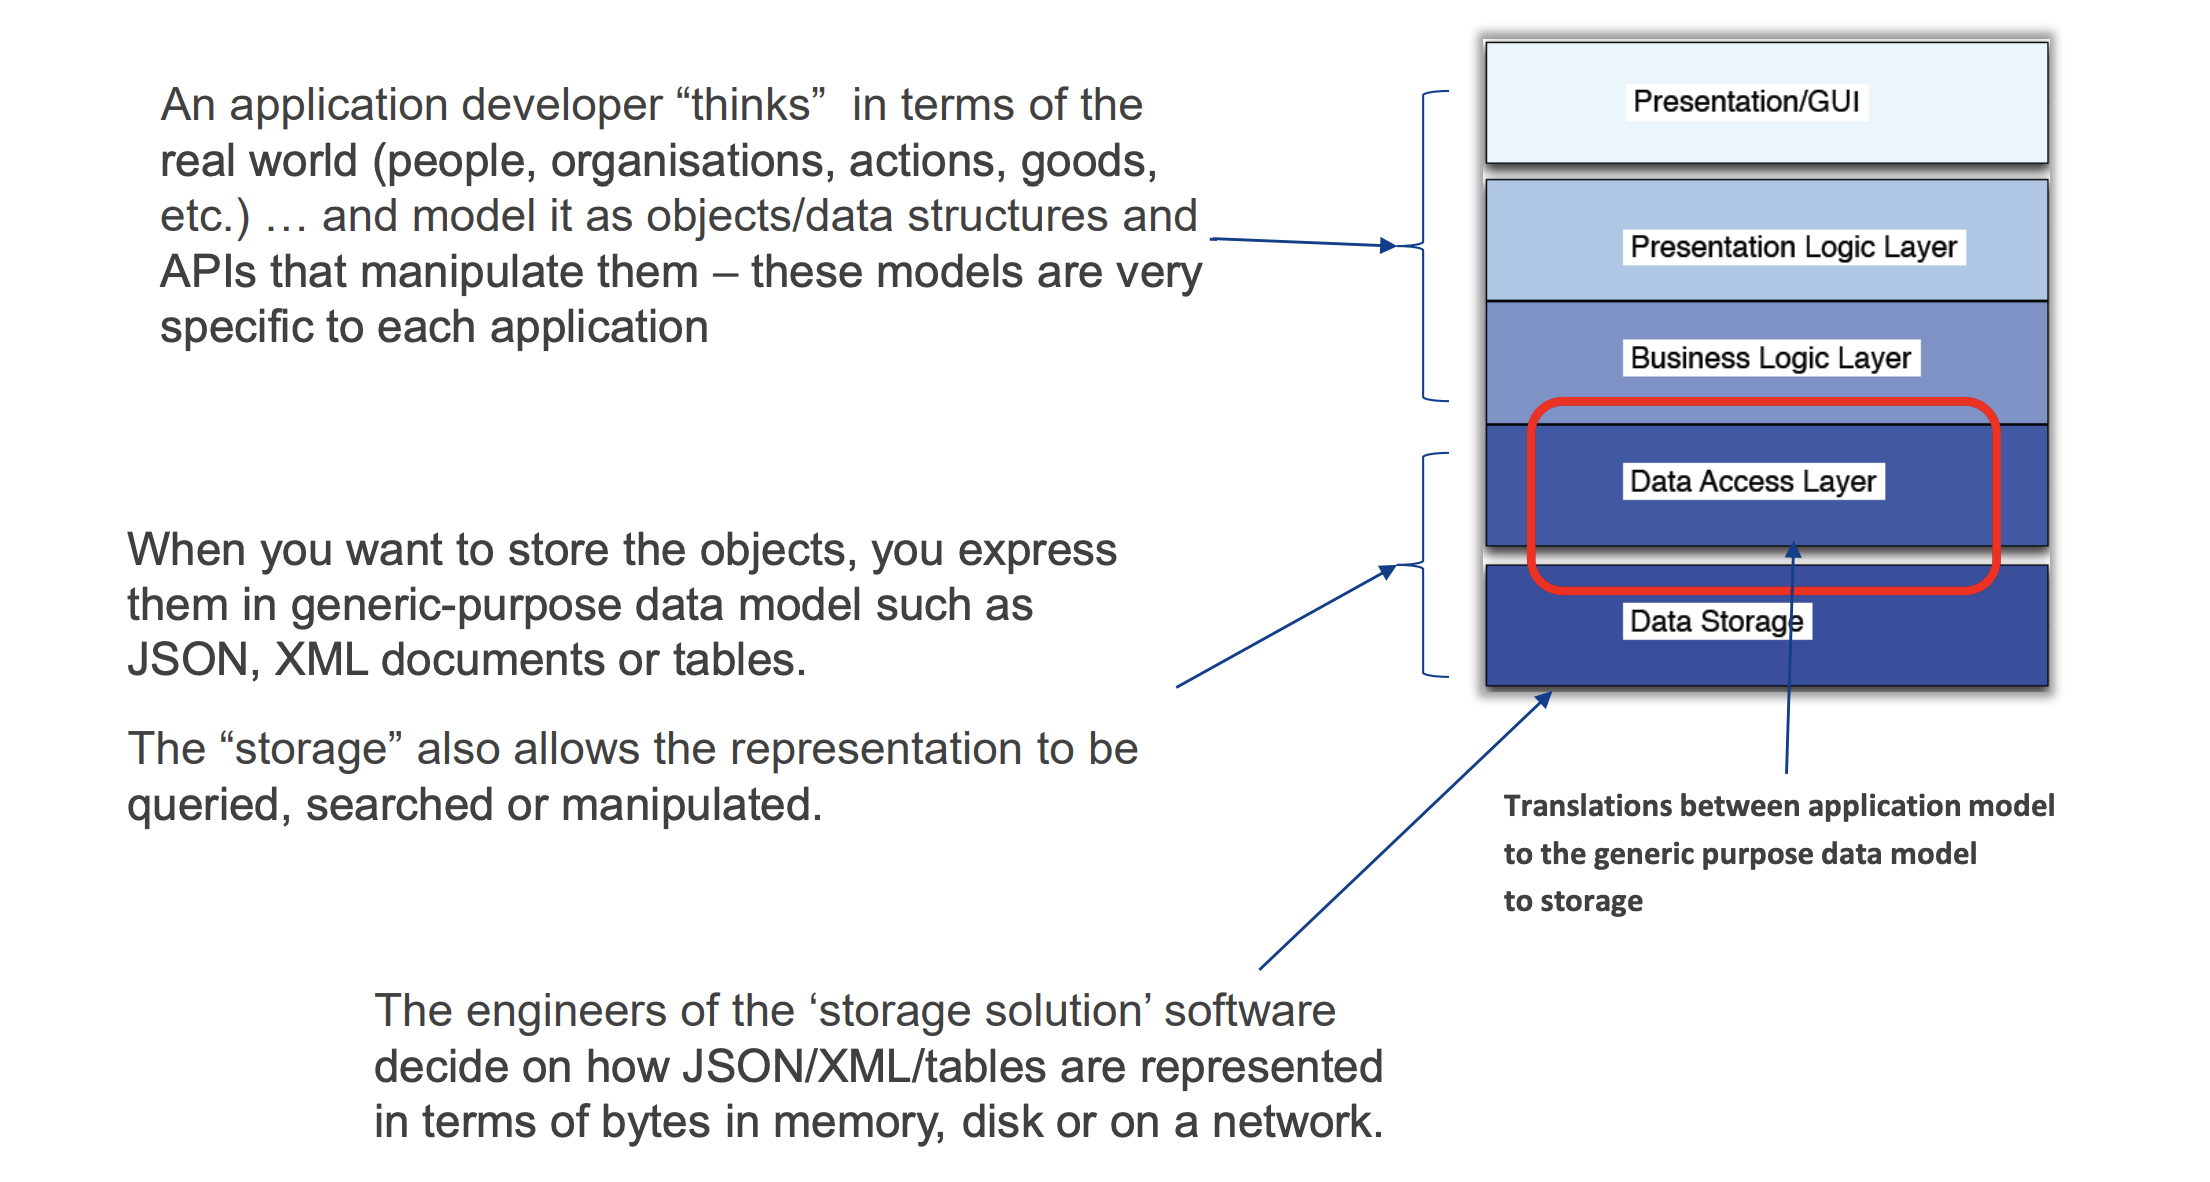
The Object-Relational Mismatch (Impedance Mismatch)
- Refers to the problem of a mismatch between application data model (your business objects) and data model for storage (in relational tables)
- This mismatch creates a need for an awkward translation layer between the objects in the application code and the database model of tables/row/columns.
And the structure model
SQL VS MongoDB
| RDMBS | MongoDB |
|---|---|
| Database | Database |
| Table | Collection |
| Tuple/Row | Document |
| column | filed |
| Table join | Embedded Document |
| Primary Key | Primary Key(provided by mongodb itself) |
PS: Collections do not require a schema. Document within a collection can have different filelds
MongoDB更适合做数据分析。eg:
Relational vs. Document
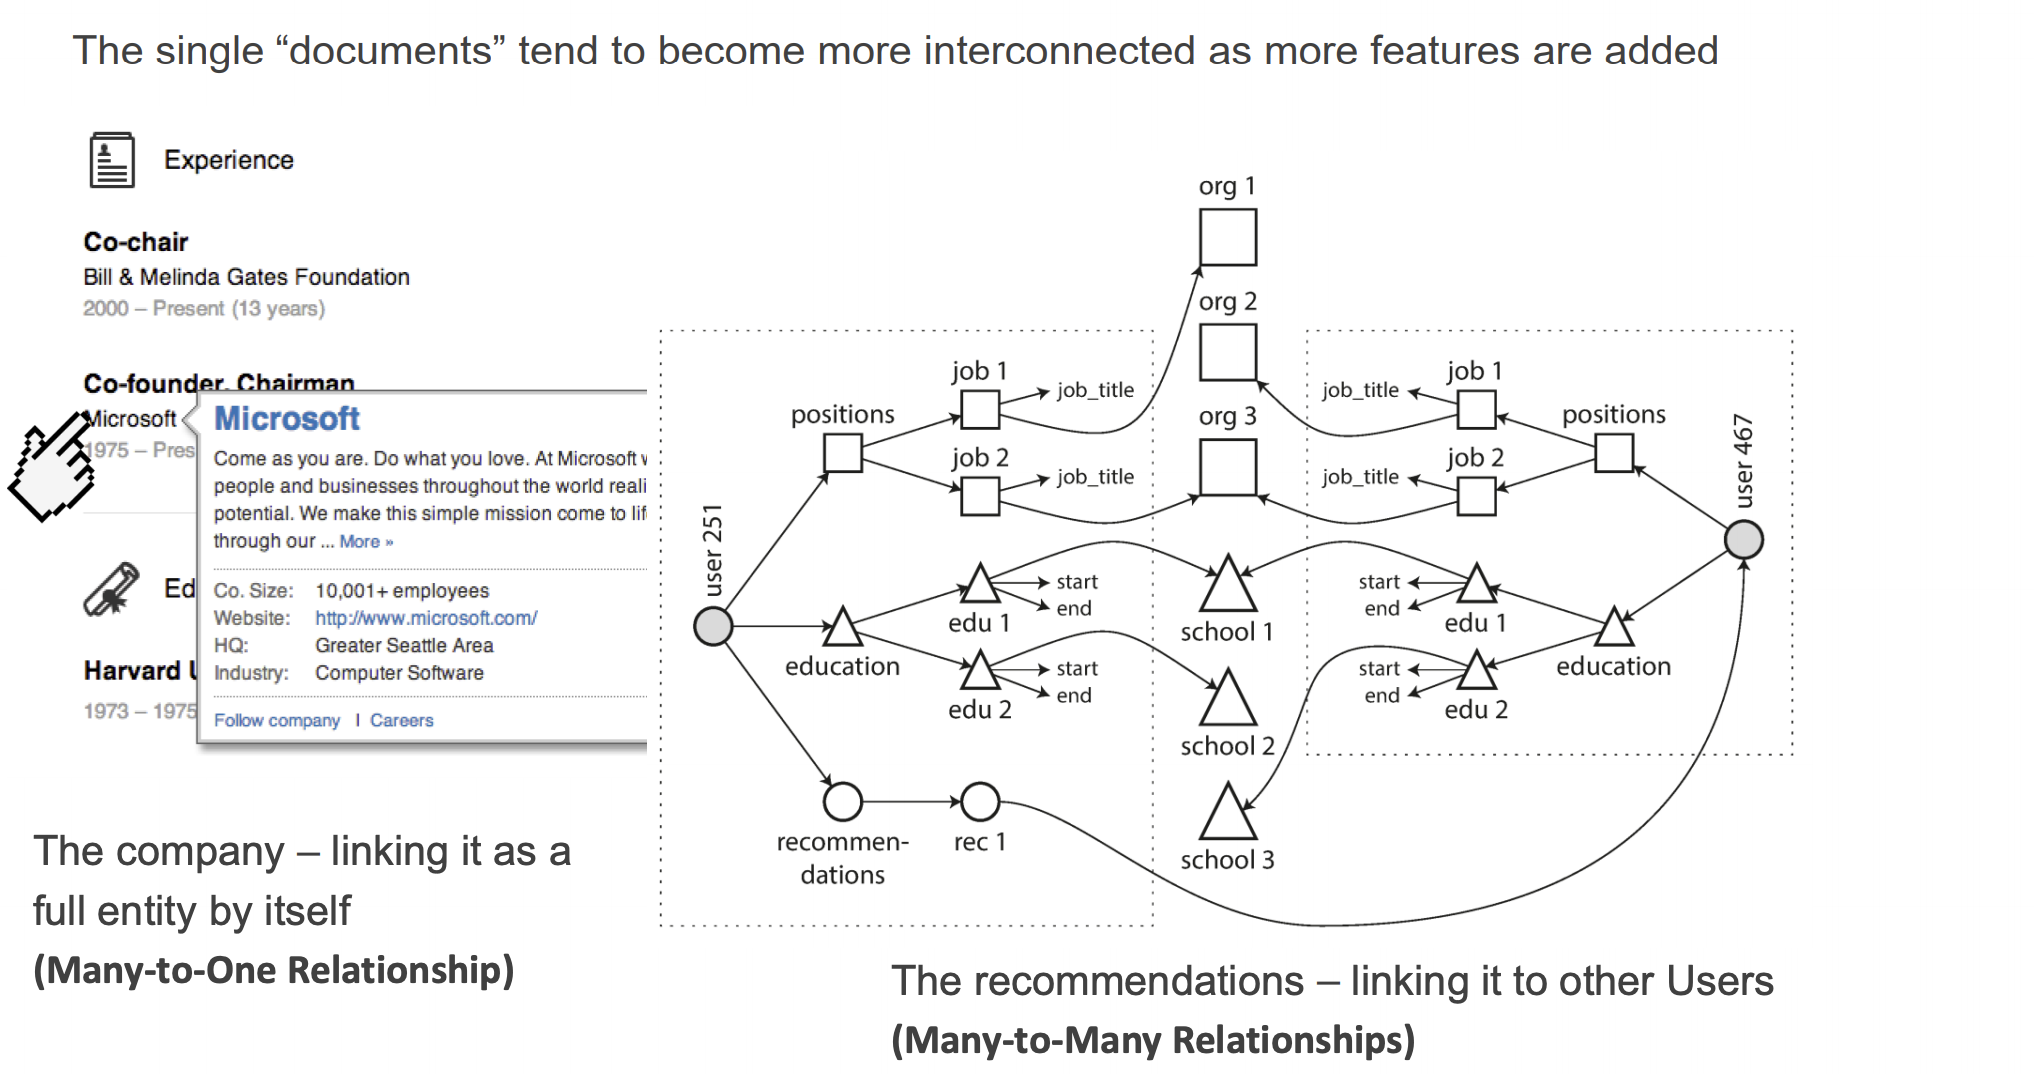
Which data model leads to simpler application code?
- If the application data model looks like a tree (document-like) -> it can be loaded at once using document-based model
- If M-M relationships are central to the application data model -> relational model is efficient in joins. If document model is used, some of the ‘join’ logic will have to move to application code
Consider the kinds of relationships between data items. If they are highly interconnected data (e.g., social network)
- document model is not so good,
- relational model is OK …
- graph models would be natural (to be seen later
Relational:适合做关联数据
Document:适合做数据分析,类似树的结构
About schema flexibility, good or bad?
- Most document-based database do not enfore any schema in documents(schema-less databases,可以插入任何类型的数据)
- Schema-on-read
- The structure of the data is implicit, only interpreted when the data is read by application code
- ≈ dynamic (runtime) type checking
- Schema-on-write
- The traditional approach of RDB - explicit schema and the database ensures all written data conforms to it
- ≈ static (compile-time) type checking
- When application wants to change the format of its data then schema-on-read/write does matter (eg: User name in one field -> User name in two fields.)
Graph database
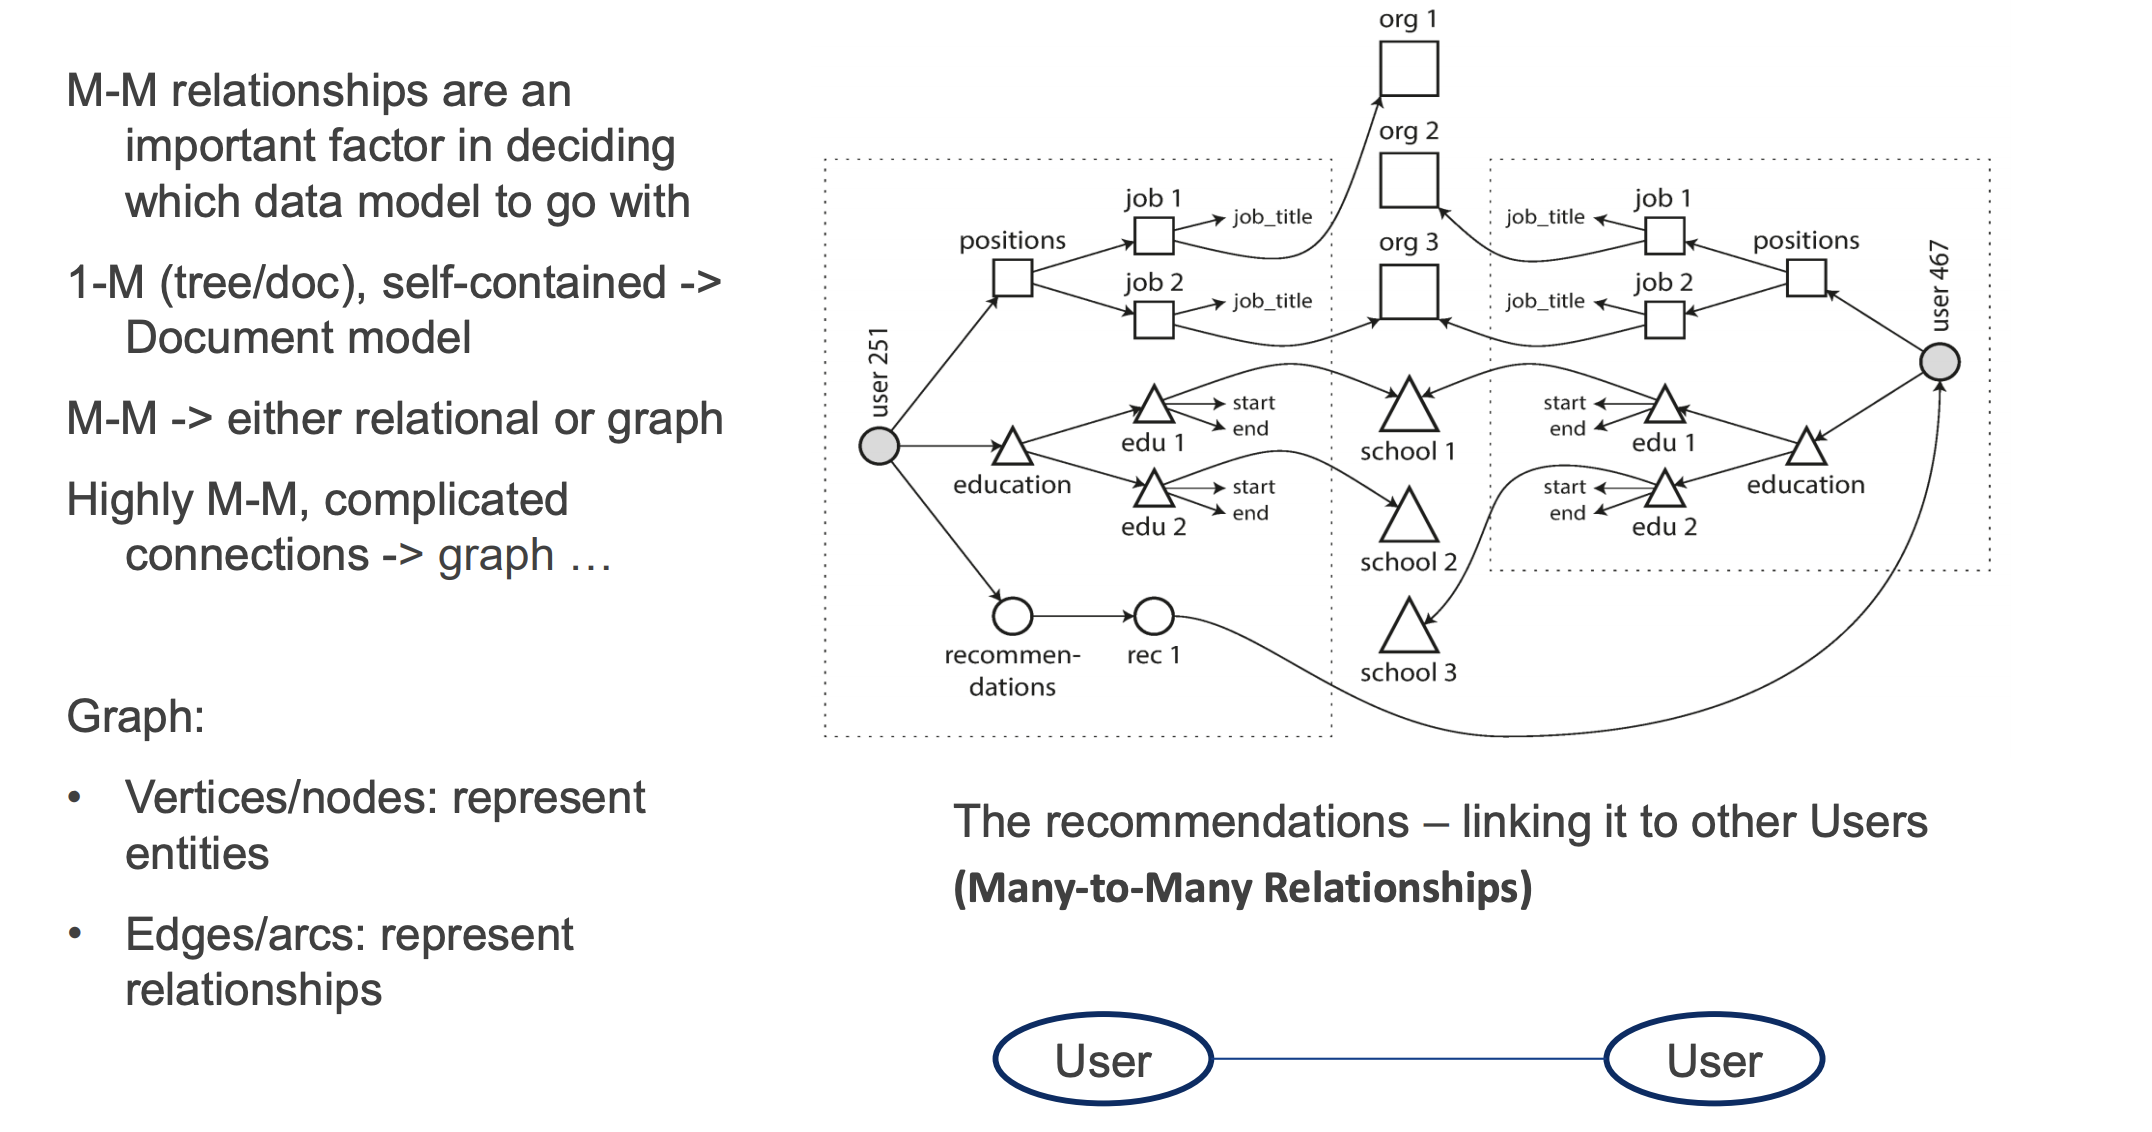
Vertices are not limited to the same type of data.
Manage and publish metadata
*Metadata: * Metadata is a “map”, is a means by which the complexity of an object is represented in a simpler form. Include:
- Descriptive metadata: description of an object
- Administrative metadata: information about the origin and maintenance of an object
- Structural metadata: information about how an object is organised (e.g., ToC)
- Provenance metadata: traces/processes involved in producing the object.
Labs and soultion
*Prepare for lab: *
- Install
pandas:pip3 install pandas - Install
requests:pip3 install requests
All the data_frame = read_csv('xx.csv')
CSV files
Download the csv files:
1
wget https://raw.githubusercontent.com/mysilver/COMP9321-Data-Services/master/Week2_DataAccess/Demographic_Statistics_By_Zip_Code.csv
Read csv file in pandas
因为pandas已经封装好的有读取
csv文件的库,所以我们只需要调用该库即可1
2
3
4
5
6
7import pandas as pd
def read_csv(filename):
"""
:param filename: the filename which need to read
"""
return pd.read_csv(filename)Print row and column
在print column的时候我们直接输出df即可,row我们可以使用
iterrows的方法1
2
3
4
5
6data_frame = read_csv("xx.csv")
# show col
print(", ".join([col for col in data_frame]))
# show row
for index, row in data_frame.iterrows():
print(", ".join([str(row[col]) for col in data_frame]))Store in csv
导出csv文件也有相对应的库:
to_csv1
2
3
4
5
6
7def store_scv(data_frame, filename):
"""
:param data_frame: the pandas data frame
:param filename: the filename which need to be stored
:return:
"""
data_frame.to_csv(filename, sep=',', encoding='utf-8')
SQlite files
Firstly, we need to connect to the sqlite file by using
sqlitepackage. (Install sqlite:pip3 install sqlite3)All the
conn=conn_db('xx.db')Connect to the database
1
2
3
4
5
6def conn_db(filename):
"""
:param filename: the filename of db
:return: return the cursor
"""
return sqlite3.connect(filename)Store all the data into sqlite file
1
2
3
4
5
6
7
8def store_sqlite(data_frame, table_name, conn):
"""
:param conn: sqlite3 con
:param data_frame: the pandas data frame
:param table_name: the tables name in sql
:return:
"""
data_frame.to_sql(table_name, conn)Query by pandas
1
2
3
4
5
6
7def read_db(query, conn):
"""
:param query: query language (eg: "SELECT * FROM xx")
:param conn: connect sqlite3
:return: the data frame after reading database
"""
return pd.read_sql_query(query, conn)
NoSql
在做lab之前应该先安装MongoDB,具体的可以Google一下
应该先安装
pymongo(pip3 install pymongo)Connect MongoDB
1
2
3
4
5
6
7
8
9
10def connect_mongo(database_name, collection, host='127.0.0.1', port='27017'):
"""
:param collection: the database collection
:param database_name: which database need to connect
:param host: the host of mongodb
:param port: the port of mongodb
:return: cursor
"""
client = MongoClient('mongodb://%s:%s/' % (host, port))
return client[database_name][collection]Store data into MongoDB
1
2
3
4
5
6
7
8
9
10
11
12
13def store_mongo(db, data_frame):
"""
:param db: database
:param data_frame: the data frame
:return:
"""
data = []
for index, row in data_frame.iterrows():
t = {}
for col in data_frame:
t[col] = str(row[col])
data.append(t)
db.insert_many(data)
RESTful
We use
requeststo get web data.Get web data
1
2
3
4
5
6
7
8
def get_web_json(url):
"""
get the json file from an url
:param url: the json url
:return:
"""
res = requests.get(url)
return res.json()
Week 2 Data Cleansing
Why data cleaning
- Datasets are messy, messy data can give wrong insights
- Data cleaning find and remove or correct data that detracts(减损) from the quality, and thus the usability, of data.
- The goal of data cleansing is to achieve consistent, complete, accurate, and uniform data
Dirty data
The statistics view
We want to model ideal samples of that process, but in practice we have non-ideal samples:
- Distortion(失真): some samples are corrupted by a process
- Selection Bias: likelihood of a sample depends on its value
- Left and right censorship(审查): users come and go from our scrutiny
- Dependence: samples are supposed to be independent, but are not (e.g. social networks)
The database view
- I got my hands on this data set
- Some of the values are missing, corrupted, wrong, duplicated
- Results are absolute (relational model)
- You get a better answer by improving the quality of the values in your dataset
The Domain Expert’s View:
Domain experts have an implicit model of the data that they can test against…
- This Data Doesn’t look right
- This Answer Doesn’t look right
The Data Scientist’s View:
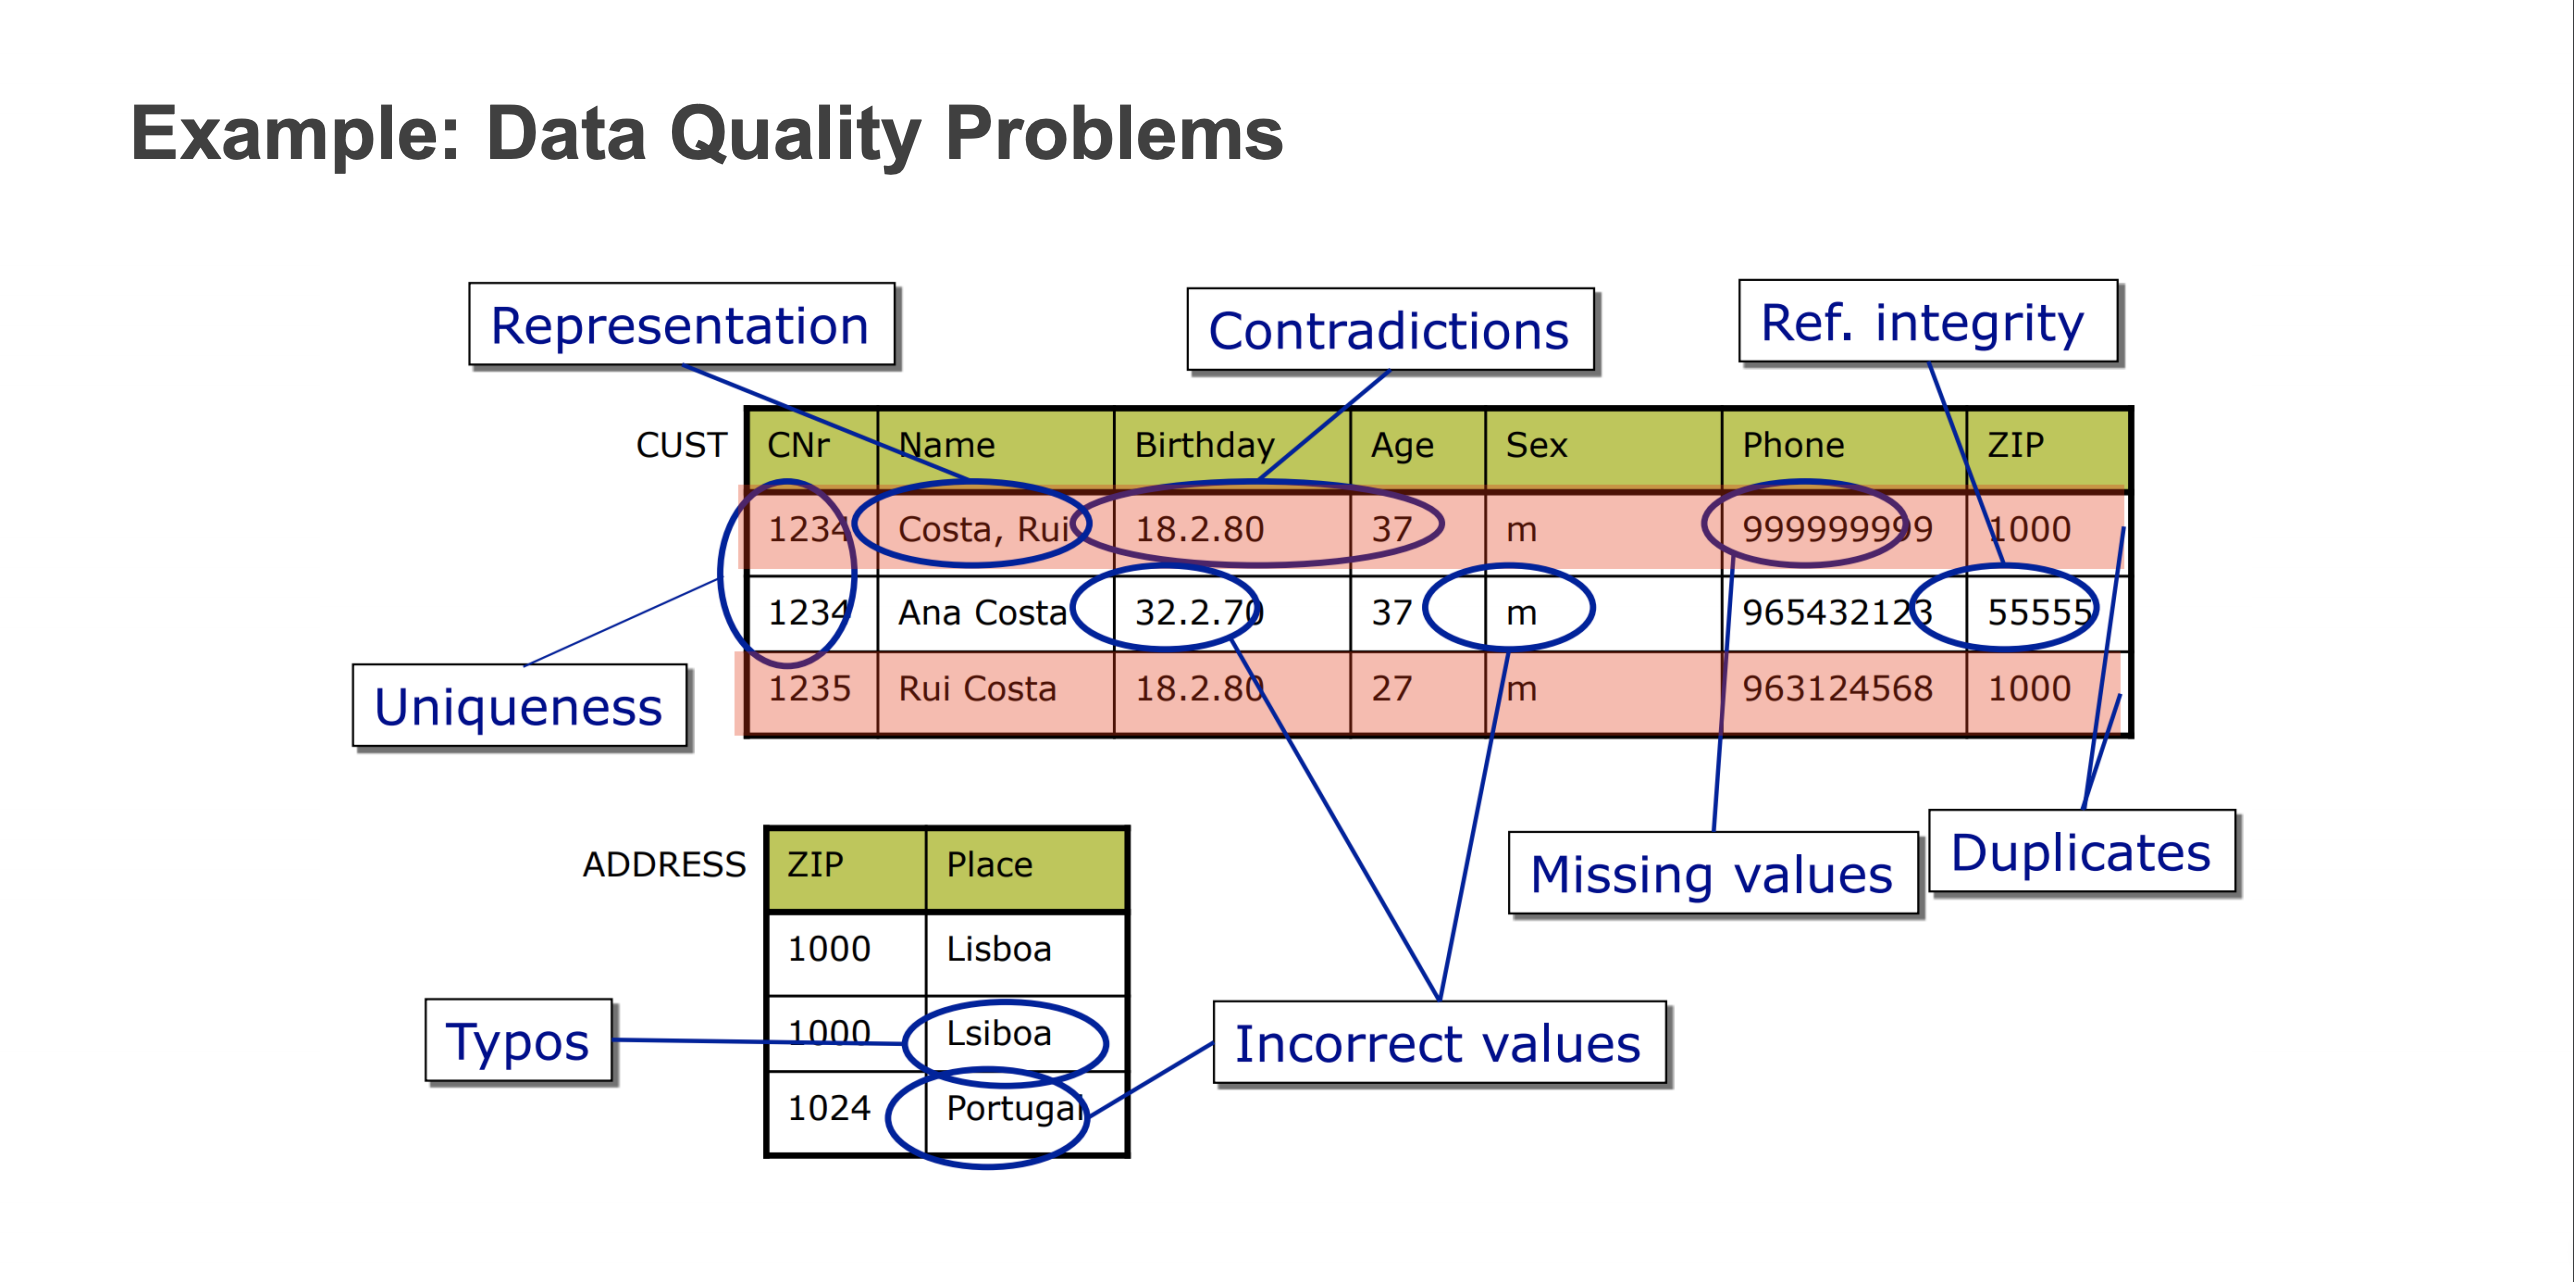
Example about dirty data
Data quantity problem
- (Source) Data is dirty on its own.
- Transformations corrupt the data (complexity of software pipelines).
- Data sets are clean but integration (i.e., combining them) mess them up.
- “Rare” errors can become frequent after transformation or integration.
- Data sets are clean but suffer “bit rot”
- Old data loses its value/accuracy over time
- Any combination of the above
How data quantity problem happen
Incomplete data come from:
- non available data value when collected
- different criteria between the time when the data was collected and when it is analyzed
- human/hardware/software problems
*Noisy data comes from: *
- data collection: faulty instruments (有缺陷的仪器)
- data entry: human or computer errors
- data transmission
Inconsistent (and duplicate) data comes from:
- Different data sources, so non-uniform naming conventions/data codes
- Functional dependency and/or referential integrity violation(功能依赖性和/或参照完整性违规)
Application Scenarios(应用场景)
Integrate data from different sources(整合来自不同来源的数据)
- eg:populating data from different operational data stores or a mediator-based architecture Eliminate errors and duplicates within a single source
Eliminate errors and duplicates within a single source (消除单一来源中的错误和重复)
- eg:duplicates in a file of customers
*Migrate data from a source schema into a different fixed target schema *
- eg: discontinued application packages
*Convert poorly structured data into structured data *
- eg:processing data collected from the Web
Data Quality Problems
Schema level data quality problems
- solution: prevented with better schema design, schema translation and integration
- Avoided by an RDBMS(Relational Database Management System)
- Missing data: product price not filled in
- Wrong data type: “abc” in product price
- Wrong data value: 0.5 in product tax (iva)
- Dangling data(不存在该类型的数据): category identifier of product does not exist
- Exact duplicate data: different persons with same ssn
- Generic domain constraints: incorrect invoice price
- Not avoided by an RDBMS(无法避免的)
- Wrong categorical data: countries and corresponding states
- Outdated temporal data: just-in-time requirement
- Inconsistent spatial data(空间数据不一致???): coordinates and shapes
- Name conflicts: person vs person or person vs client
- Structural Conflicts: addresses
Instance level data quality problems
- solution: errors and inconsistencies of data that are not prevented at schema level
- Single record
- Missing data in a not null field – ssn:-9999999
- Erroneous data – price:5 but real price:50
- Misspellings: Morty Al-Banna vs Morty Al-Banana
- Embedded values: dr. Morty Al-Banna
- Misfielded values: city: Australia
- Ambiguous data(不明确信息): M.Al-Banna,Sydney,Australia
- Multiple records
- Duplicate records: Name:Morty Al-Banna, Birth:01/01/1980 and Name: Morty Al-Banna, Birth:01/01/1980
- Contradicting records(矛盾记录): Morty Al-Banna, Birth:01/01/1980 and Name: Morty Al-Banna, Birth:01/01/1982
- Non-standardized data(不标准的数据): Morty Al-Banna vs Al-Banna, Morty
Data Cleaning Makes Everything Okay?
In fact, the data were rejected as unreasonable by data quality control algorithms
Conventional Definition of Data Quality
Accuracy
- Closeness between a value v and a value v’.: considered as the correct representation of the realworld phenomenon that v aims to represent.
- eg: for a person name “John”, v’=John is correct, v=Jhn is incorrect
- Syntatic accuracy(语法准确性):closeness of a value v to the elements of the corresponding definition domain D
- Semantic accuracy(语义准确性):closeness of the value v to the true value v’
- e.g., Donald Trump vs The Donald
- Closeness between a value v and a value v’.: considered as the correct representation of the realworld phenomenon that v aims to represent.
Completeness
- Schema completeness: degree to which concepts and their properties are not missing from the schema
- Column completeness: evaluates the missing values for a specific property or column in a table.
- Population completeness(总体完整性): evaluates missing values with respect to a reference population
- The presence/absence and meaning of null values(空值的存在/不存在和含义)
- Validity of open world assumption (OWA) or closed world assumption (CWA)
- OWA: cannot state neither the truth or falsity of facts not represented in the tuples of a relation
- CWA: only the values actually present in a relational table and no other values represent facts of the real world.
- OWA: No, have a correct answer
- CWA: Unknown, (不确定的答案)
Uniqueness
Timeliness
Consistency(一致性)
Others:
- Interpretability: concerns the documentation and metadata that are available to correctly interpret the meaning and properties of data sources
- Synchronization between different time series: concerns proper integration of data having different time stamps.
- Accessibility: measures the ability of the user to access the data from his/her own culture, physical status/functions, and technologies available.
Understanding the data by using Python
代码部分,学习一下DataFrame:
1 | pandas.DataFrame( data, index, columns, dtype, copy) |
| 参数 | 描述 |
|---|---|
| data | 数据采取各种形式,如:ndarray,series,map,lists,dict,constant和另一个DataFrame。 |
| index | 对于行标签,要用于结果帧的索引是可选缺省值np.arrange(n),如果没有传递索引值 |
| columns | 对于列标签,可选的默认语法是 - np.arange(n)。 这只有在没有索引传递的情况下才是这样 |
| dtype | 每列的数据类型。 |
| copy | 如果默认值为False,则此命令(或任何它)用于复制数据 |
1 | import pandas as pd |
输出结果:
1 | Empty DataFrame |
示例-1:
1 | import pandas as pd |
结果:
1 | Name Age |
从dict来创建DataFrame:
1 | import pandas as pd |
结果:
1 | name age |
describe()的使用:This function returns the count, mean, standard deviation, minimum and maximum values and the quantiles of the data.
.shape: view the number of samples and features we’re dealing with
head(), tail(): you can easily check out the first and last 5 lines of your DataFrame, respectively.
Dealing with Missing Data
假设我们有一个DataFrame:
1 | import pandas as pd |
输出结果:
1 | name age |
代表这个DataFrame存在一个确实的数据
pandas中提供了isnull()和notnull()两个函数来监测是否缺少值
1 | import pandas as pd |
结果:
1 | 0 False |
缺少数据的计算
- 在求和数据时,
NA将被视为0 - 如果数据全部是
NA,那么结果将是NA
1 | import pandas as pd |
清理/填充缺少数据
fillna()函数可以通过几种方法用非空数据“填充”NA值。
1 | import pandas as pd |
填写NA前进和后退
pad/fill: 填充方法向前
bfill/backfill: 填充方法向后
1 | import pandas as pd |
删除缺少的值
把NaN那一行的数据去掉,可以使用dropna函数和axis参数。 默认情况下,axis = 0,即在行上应用,这意味着如果行内的任何值是NA,那么整个行被排除。
1 | import pandas as pd |
替换值
pandas可以使用replace来替换不同的值,参数使用dict形式
1 | import pandas as pd |
Labs soulution
Task 1:
- When we count
nanwe can useisnan()function, after that we just need usesum()to count how many cols. drop(col, axis=1, inplace=True)can drop multiple columns
Task 2:
- We need to use
apply(func)to deal with.apply里面的参数是一个function,比如说我使用df['Place of Publication'].apply(test), 那么test的function里面就接收到Place of Publication的值,在test里面处理完直接return就好 - Fix the data of
Date of Publication, we can usedf.str.extract(r'regx')(regx: Regex express). For more information. - Convert to number we can use
pd.to_numericfunction - For replace
nanwith 0, we can usedf.fillna(0)function
Task 3:
- Pandas alos can execute query language, but it does not work well with column names which contains white spaces, so we need to replace spcae in column names before using
df.query()
Task 4
- Merge two data frame, when the columns name are different, we can use
pandas.merge(df1, df2, how='left', left_on=['id_key'], right_on=['fk_key'])to deal with. When two keys are same, we can usepd.merge(df1, df2, on='ID'), the argoncan be a list which means base on multiple columns. df.groupby(arg1, as_index=False), arg1 is the column name.
All the code:
1 | """ |
Week 3 Visualization
因为part1部分代为占了一大部分,所以没什么内容,都是最基本的pandas的用法,可以稍微练习一下,问题不大。
What is good visualisation
Aim to create a visualisation that are accurate, tell a good story, and provide real knowledge to the audience.
- Accuracy
- Story
- Knowledge
About color using
一些常用的颜色定义请不要违反:
Graphs
Scatter Plot graphs:
- To show two variables and their correlations (i.e., X axis vs. Y axis)
lab的话因为当时在泰国,然后在赶due,就没写,不过不是很难。以后会补上的。这周的lecture没有讲什么特别多有用的东西,主要是在实现数据图例化的时候需要注意的事项。
Week 4 Visualisation
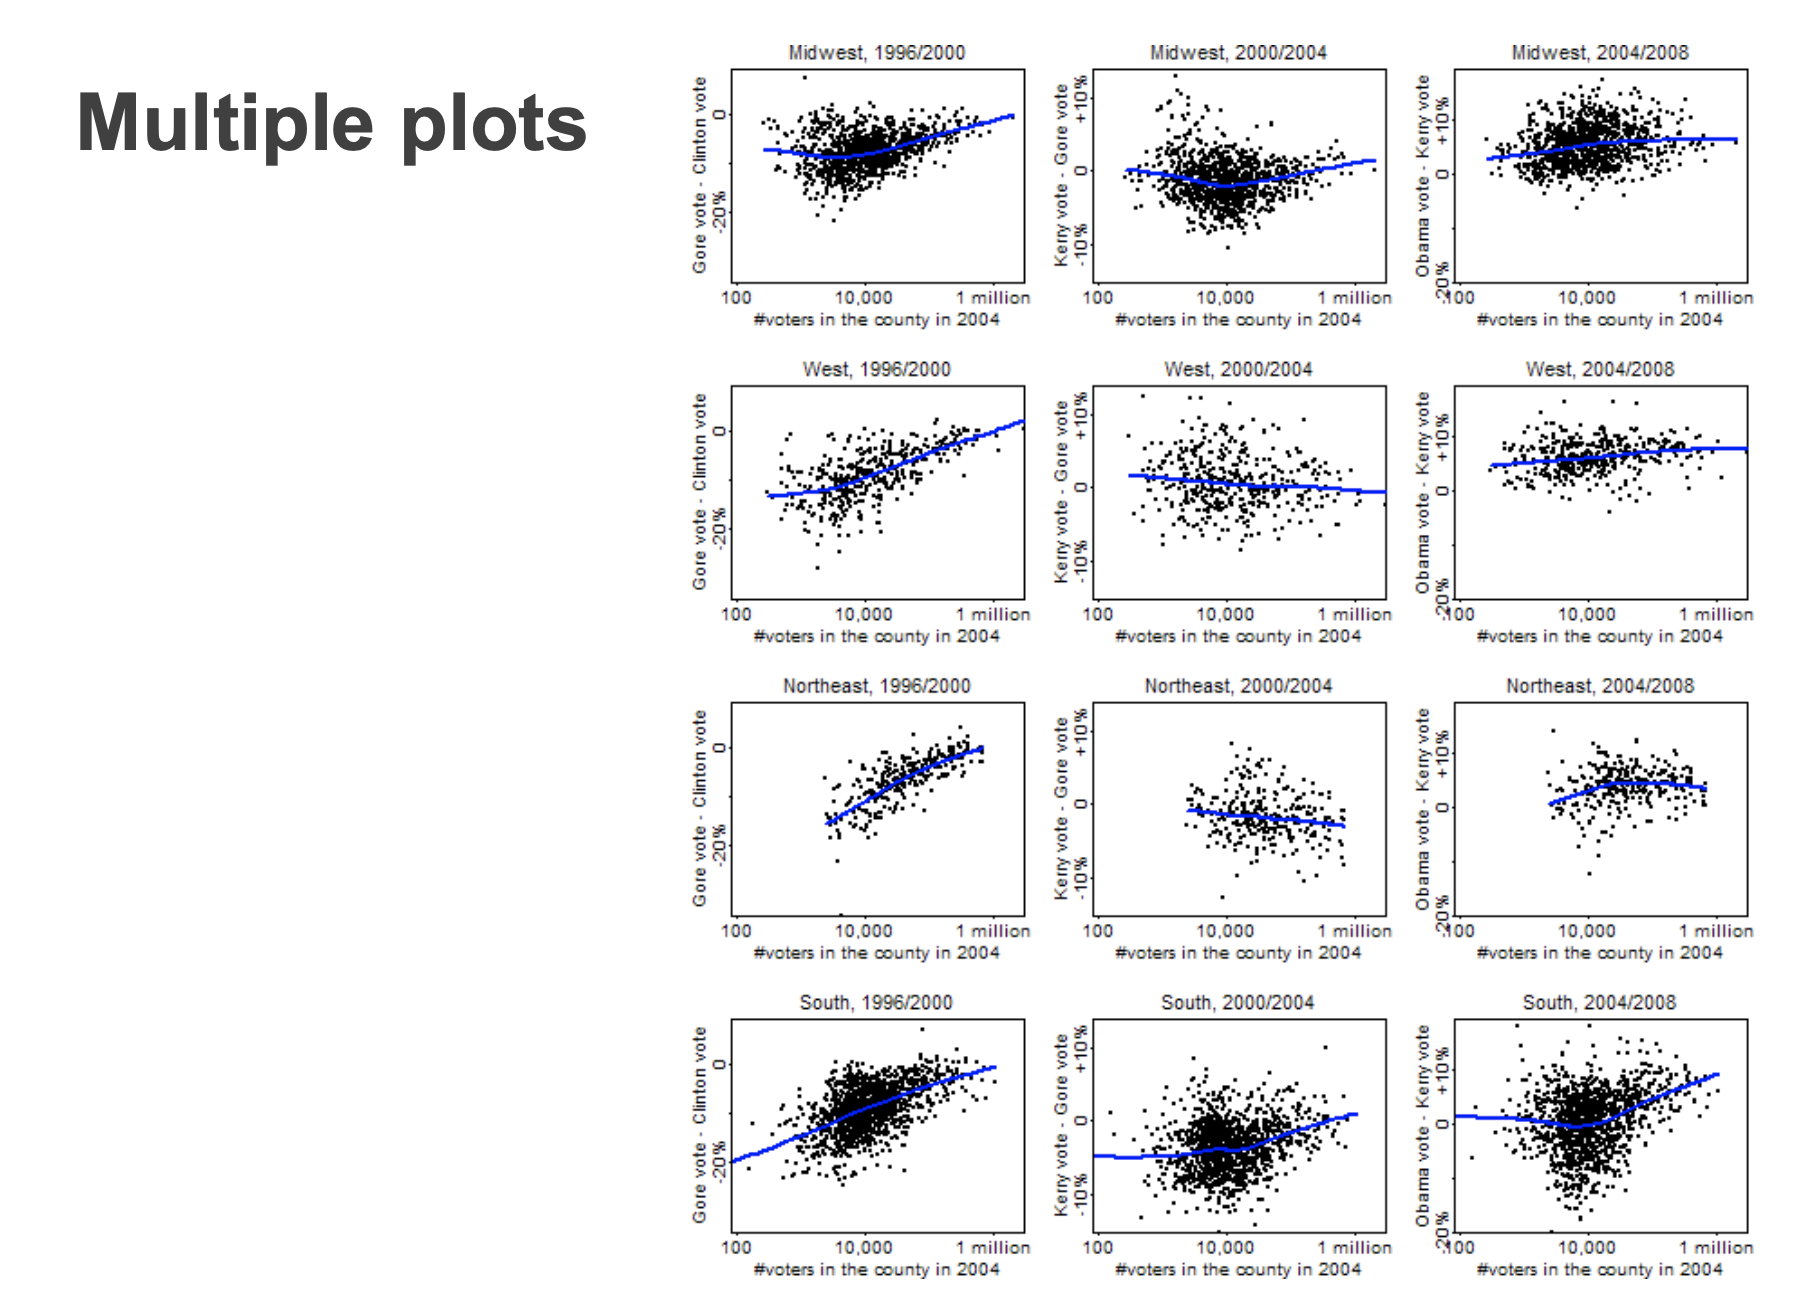
Three tricks for doing more with less
- Multiple plots
- simple, easily interpretable subplots
- can be beautiful but overwhelming
- Hybrid plots
- a scatter plot of histograms
- or a venn-diagram of histograms, etc
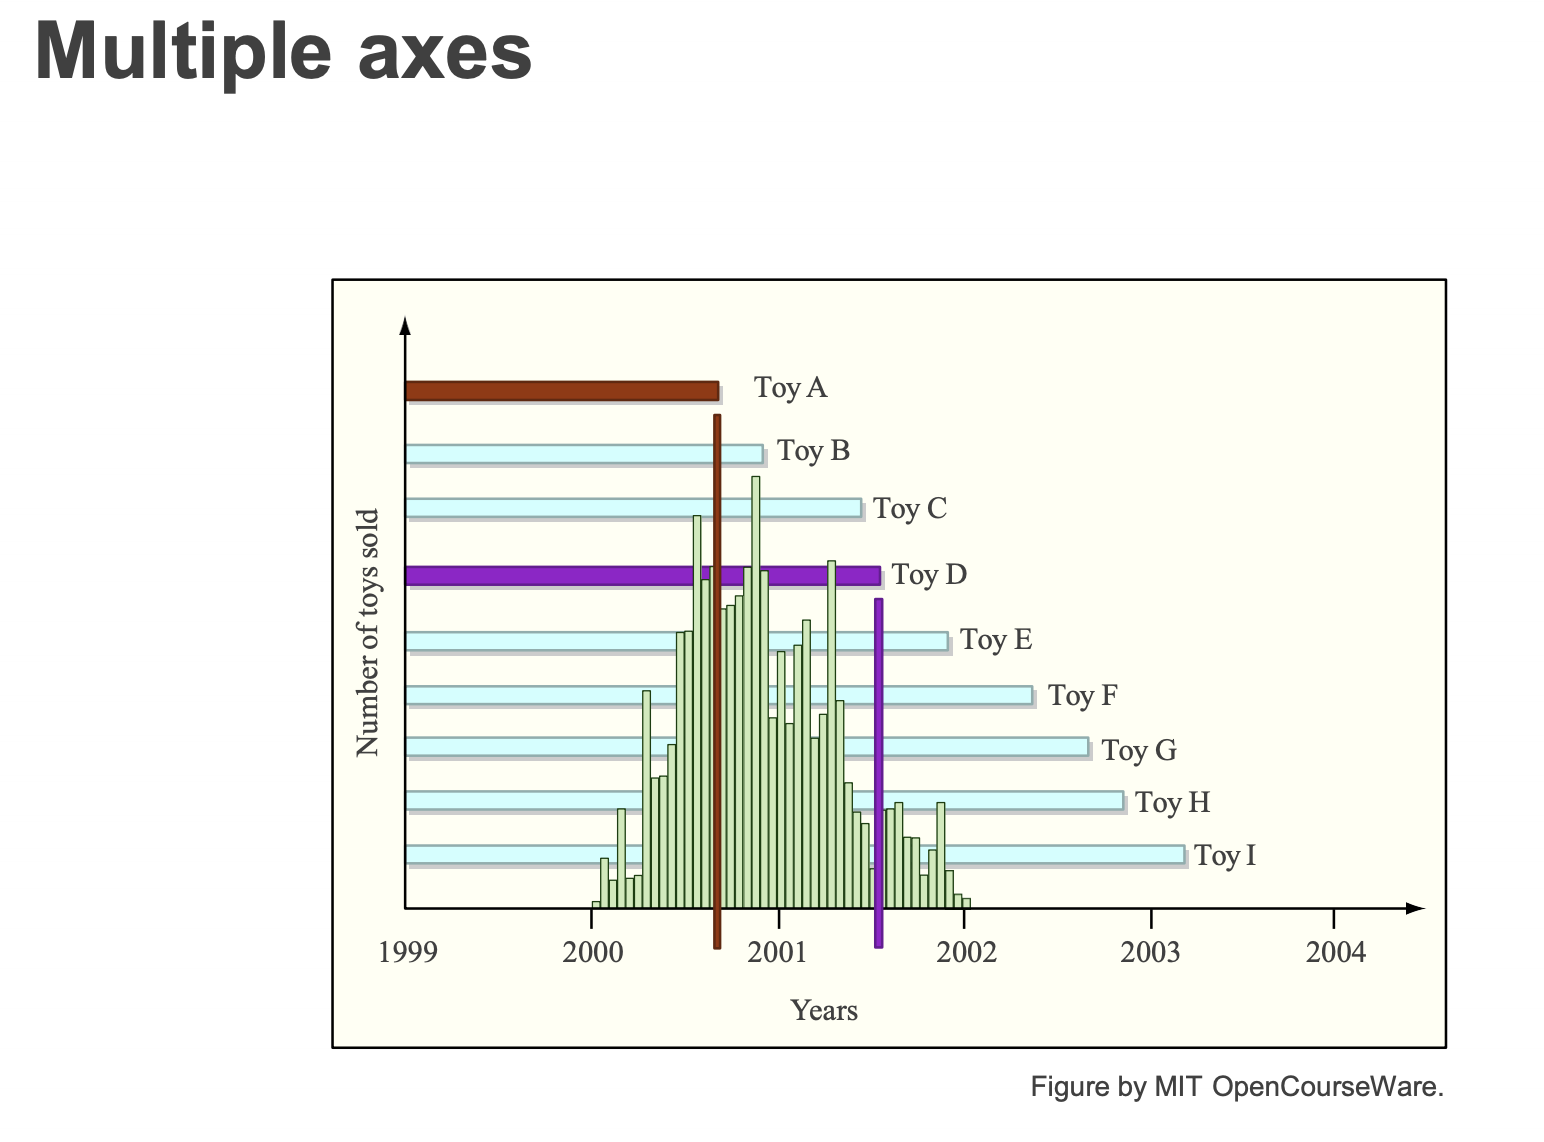
- Multiple axes
- plot two (or more) different things on one graph
Two tradeoffs
- Informativeness vs. readability (信息太少了不能表达出来要点,太多了不便于阅读,解决方法:分层)
- Too little information can conceal data
- But too much information can be overwhelming
- Possible solution: hierarchical organization?
- Data-centric vs. viewer-centric
- Viewers are accustomed to certain types of visualization
- But novel visualizations can be truer to data
Week4 REST part1
Three basic component of web:
- A Uniform Notation Scheme for addressing resources (Uniform Resource Locator - URL)
- A protocol for transporting messages (HyperText Transport Protocol - HTTP)
- A markup language for formatting hypertext documents(超文本) (HyperText Markup Language – HTML)
The steps of request a web(常见面试题):
- 解析DNS地址(根绝域名解析IP)
- client发送tcp请求到web server,建立tcp链接
- client发送http请求(一般包含header+body),请求信息
- server返回HTML超文本
- client浏览器解析HTML超文本,渲染HTML,构建DOM tree
URL里面的特殊字符:
1 | 特殊含义 十六进制 |
HTTP request method:
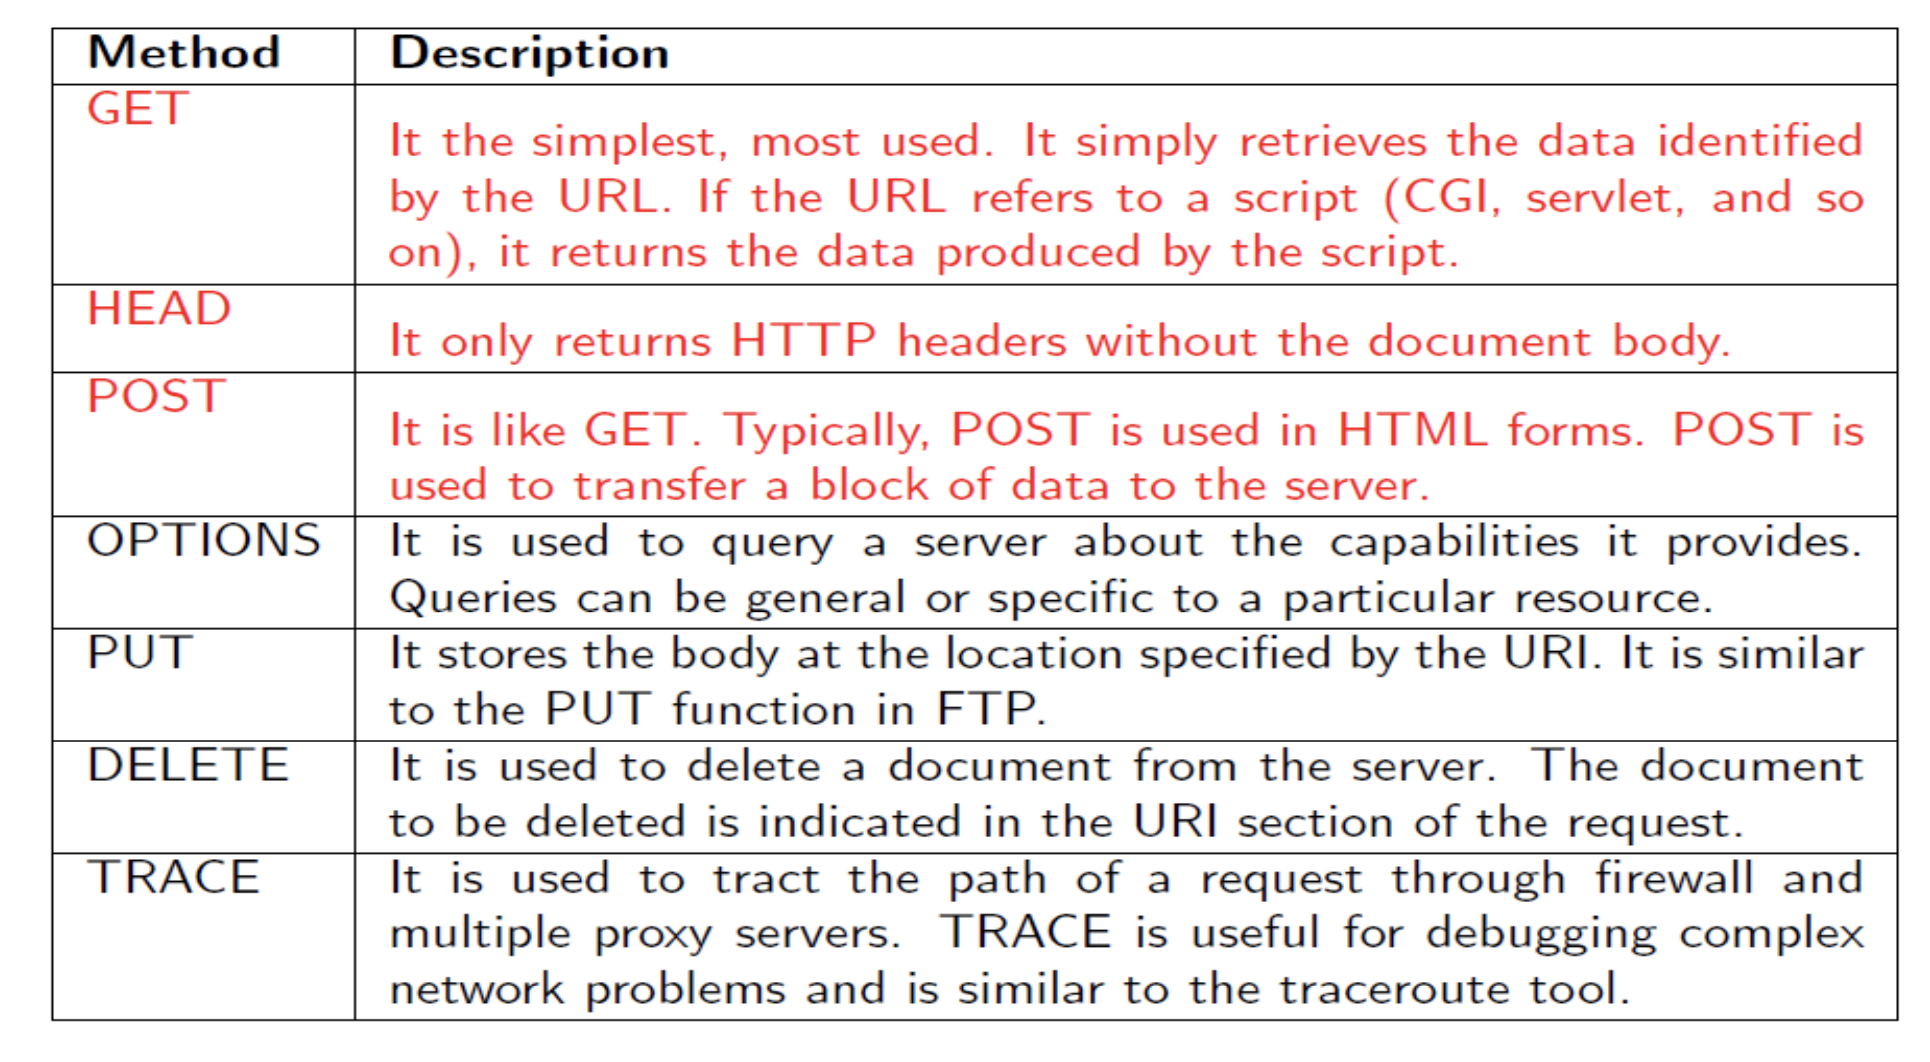
其中GET和POST最类似,但是依然有很大的差别:
在请求GET的时候只会建立一次TCP,然后POST会建立两次。因为GET会把header和body一起发送给server,POST会先发送header,如果返回100,才会接着发送body,所以建立了两次TCP
HTTP response code:
1 | 200 OK 请求成功。一般用于GET与POST请求 |
常用的:200,201,301,400,403,404,500
为什么使用web service
大家都觉得app更方便,更快捷还为什么要用web呢,其中的一个原因是因为手机的性能不如电脑。在处理一些很消耗性能的网页时电脑的优势更大,(比如选择地图直接的最短距离,这些需要很多运算的)
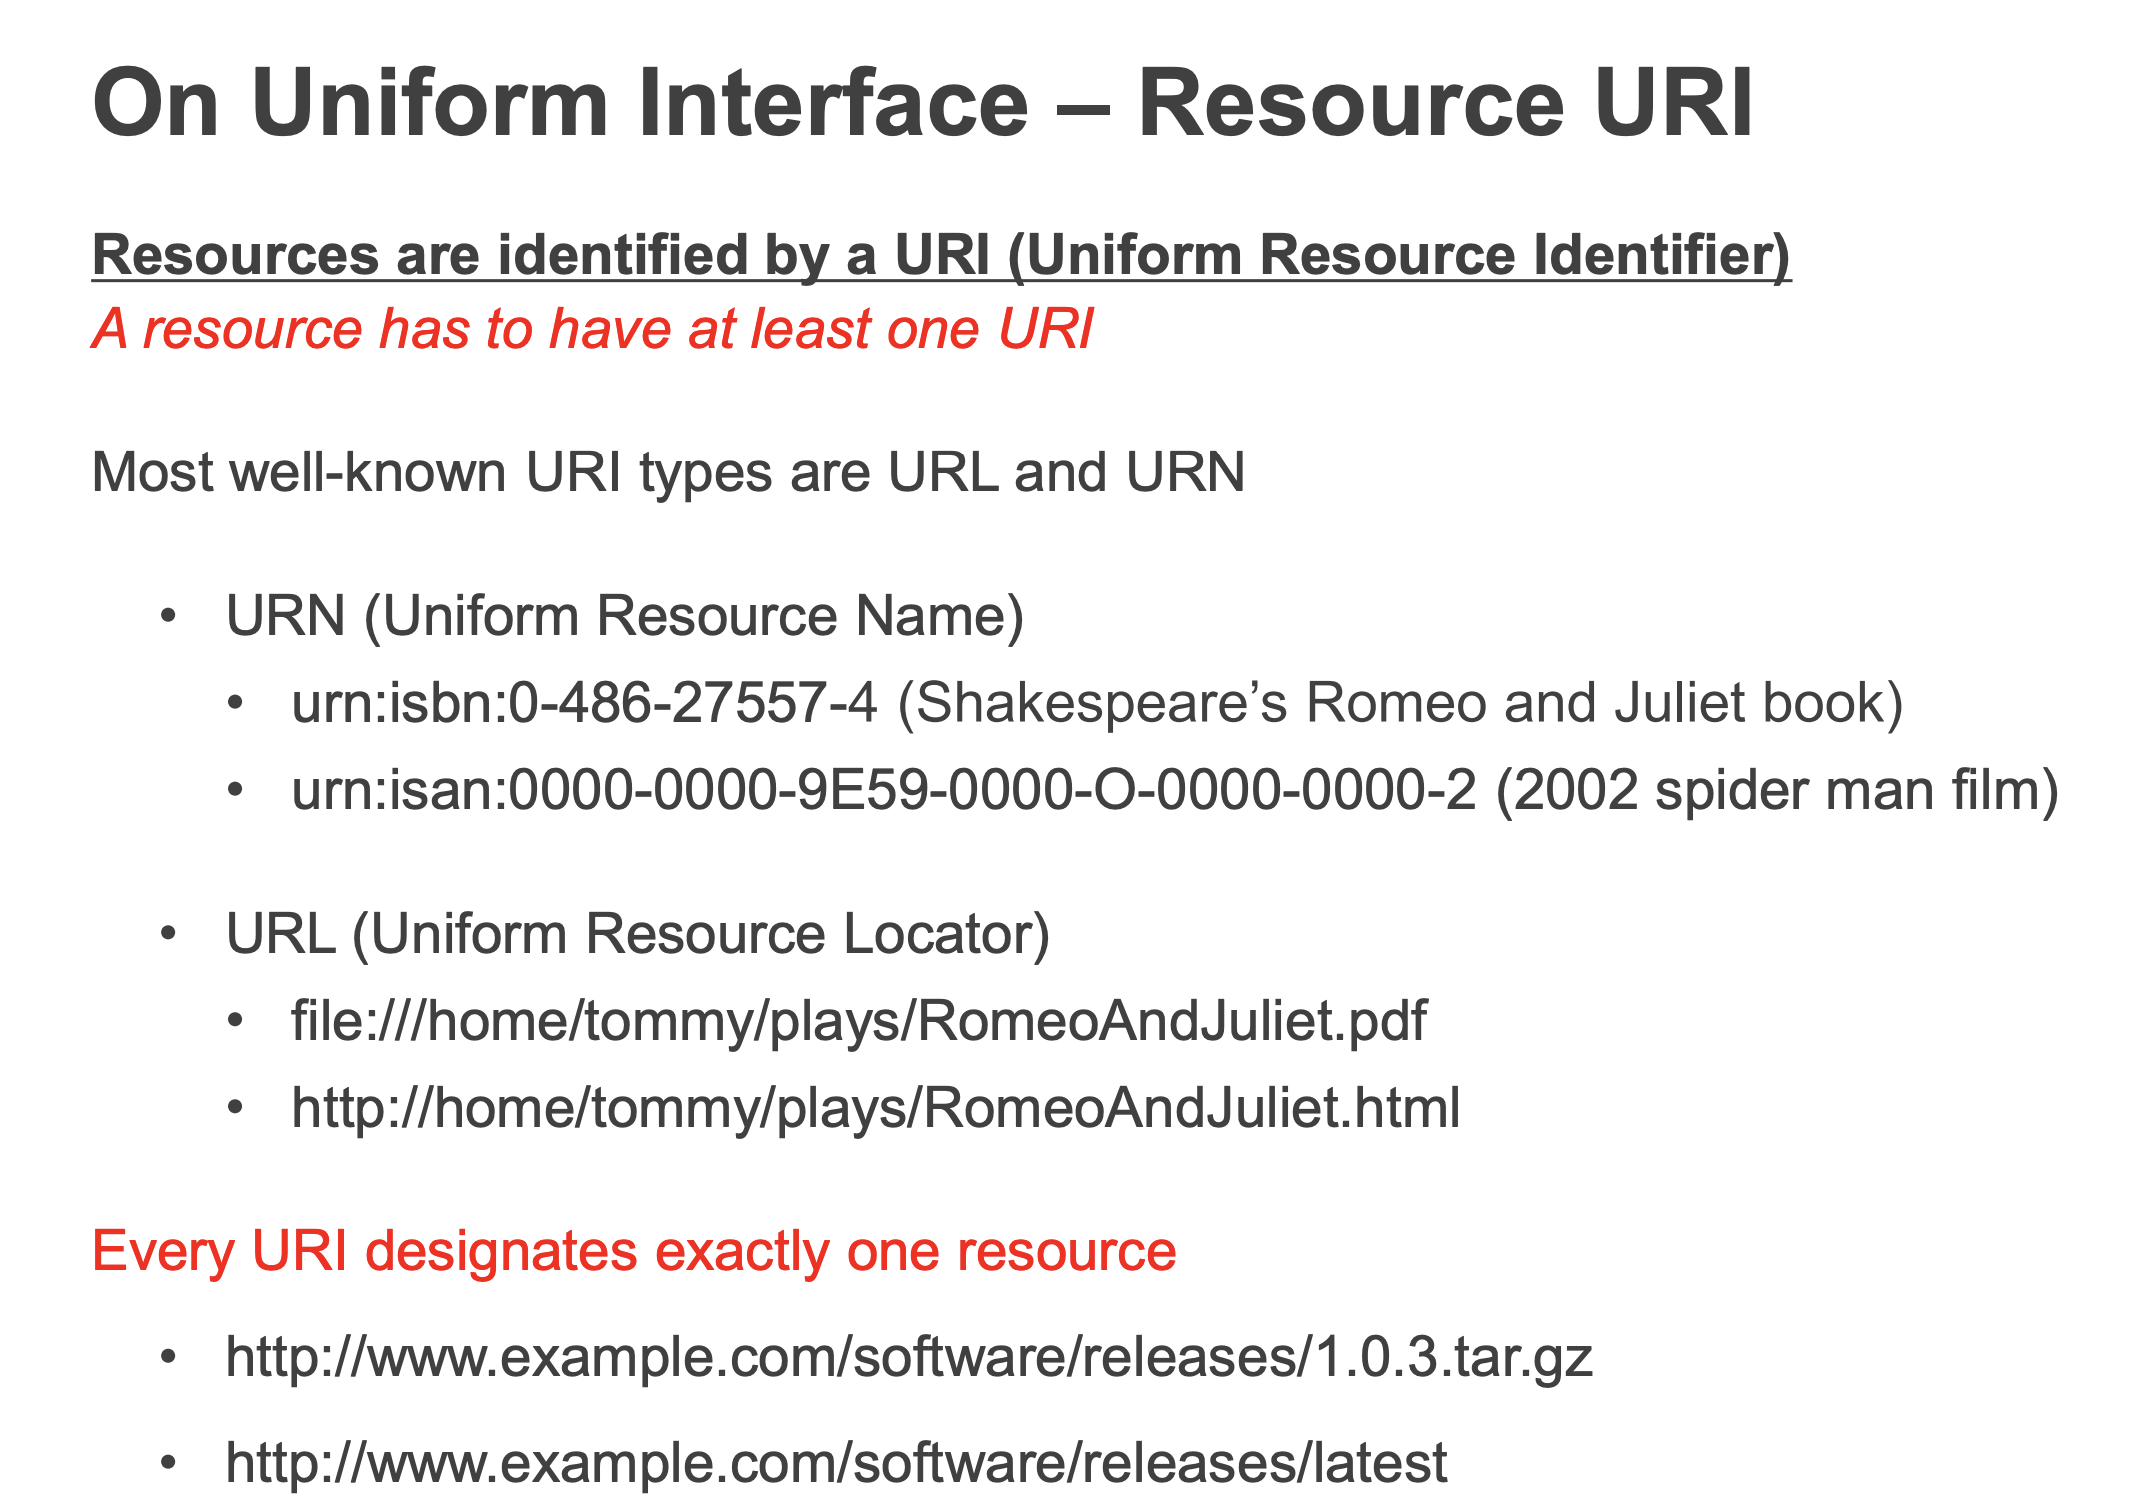
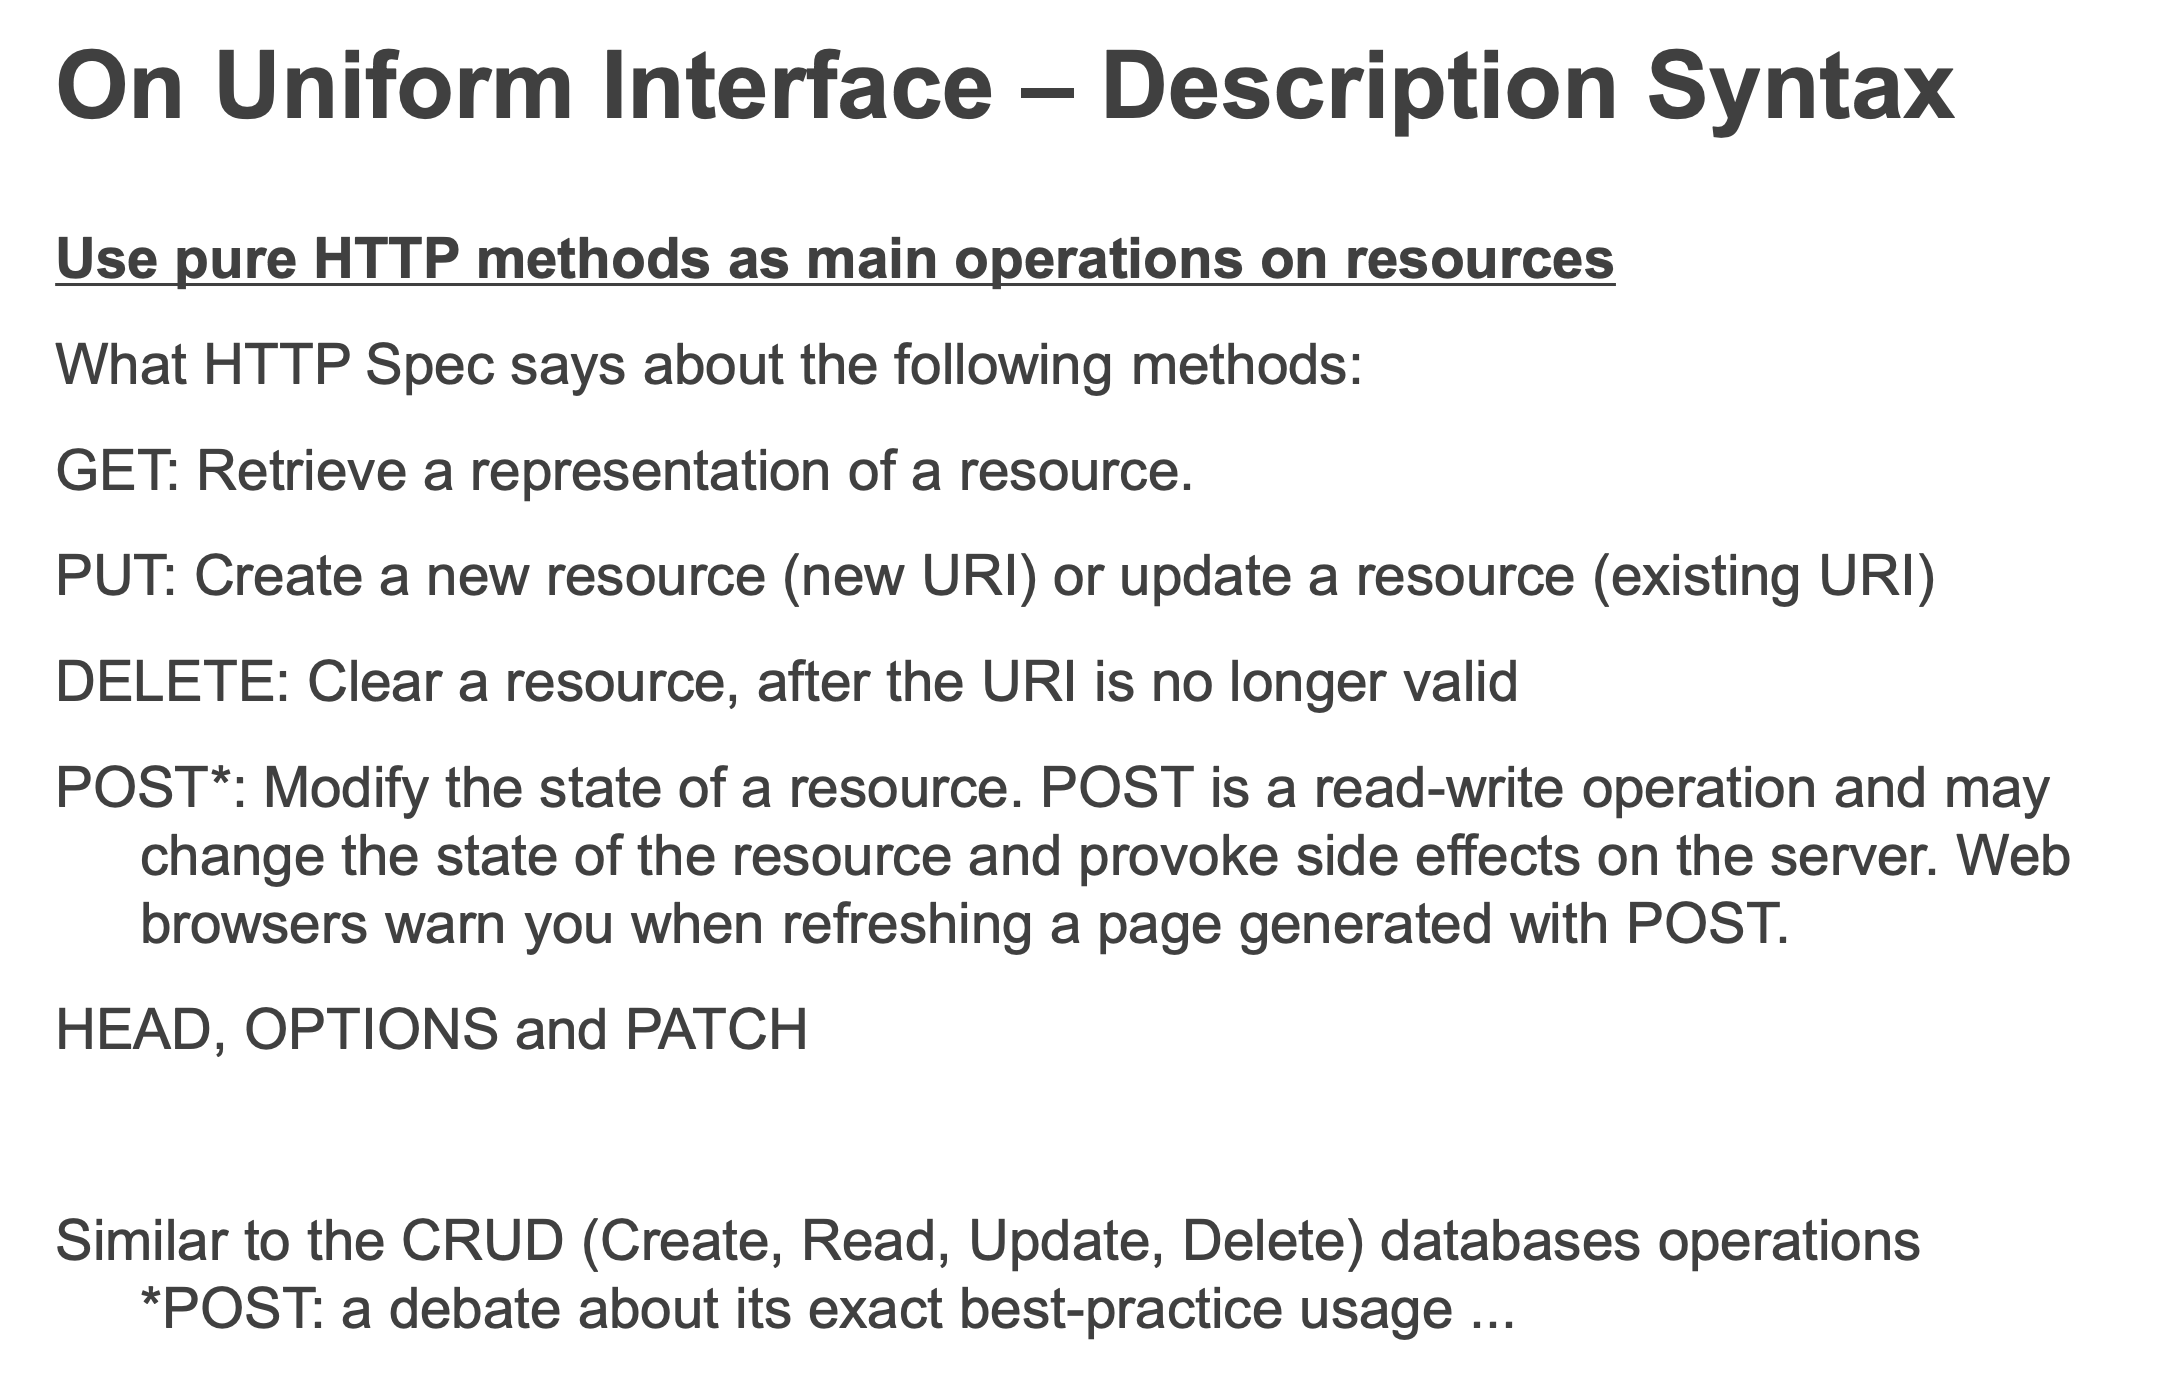
Resources in REST:
resource定义:The key abstraction of information in REST is a resource. Any information that can be named can be a resource: a document or image, a temporal service (e.g. today’s weather in Los Angeles), a collection of other resources, a non-virtual object (e.g. a person), and so on. In other words, any concept that might be the target of an author’s hypertext reference must fit within the definition of a resource.
A resource is a thing that:
- is unique (i.e., can be identified uniquely)
- has at least one representation
- has one or more attributes beyond ID
- has a potential schema, or definition
- can provide context (state) – which can change (updated)
- is reachable within the addressable universe
- collections, relationships
Architectural Constraints of REST:
其实可以理解为前后端分离的架构
- Client-Server(client and server)
- Uniform Interface(http or media)
- Statelessness
- Caching
- Layered System
- Code on demand (optional)
符合前5个就可以被称为restful api
Week 5 REST part2
Statelessness:
KEY notion: separation of client application state and RESTful resource state.
Week 6 RESTful API Security
- Least privilege: Every program and every user of the system should operate using the least set of privileges necessary to complete the job.
- Fail-safe defaults: Base access decisions on permission rather than exclusion. This principle means that the default situation is lack of access, and the protection scheme identifies conditions under which access is permitted
- Economy of mechanism: Keep the design as simple and small as possible. This well-known principle applies to any aspect of a system
- Complete mediation: Every access to every object must be checked for authority. This principle implies that a foolproof method of identifying the source of every request must be devised
- Open design: The design should not be secret. The mechanisms should not depend on the ignorance of potential attackers, but rather on the possession of specific, more easily protected, keys or passwords.
- Separation of privilege: Where feasible, a protection mechanism that requires two keys to unlock it is more robust and flexible than one that allows access to the presenter of only a single key
- Least common mechanism: Minimize the amount of mechanism common to more than one user and depended on by all users.
- Psychological acceptability: It is essential that the human interface be designed for ease of use, so that users routinely and automatically apply the protection mechanisms correctly.
- Defense in Depth: an approach in which a series of defensive mechanisms are layered in order to protect valuable data and information. If one mechanism fails, another steps up immediately to thwart an attack
怎么做加密:
第一个是HTTPS的方式进行加密,HTTPS是使用了SSL协议在传输层进行加密。
API authentication:
- HTTP Basic (and Digest) Authentication: IETF RFC 2617
- 在你访问一个需要HTTP Basic Authentication的URL的时候,如果你没有提供用户名和密码,服务器就会返回401,如果你直接在浏览器中打开,浏览器会提示你输入用户名和密码。在请求头中添加Authorization或者在url中添加用户名和密码
- 但是由于http basic是用base64加密的,所以可以解密出来明文,相当不安全。而且每次请求的时候都会带着http basic。
- Token-based Authentication
- 当服务器收到用户的登陆信息,然后使用jwt把一些信息加密成一个无序字符串,然后返回给client,client会把token储存在本地(一般是localstorage)。在每次请求的时候会带上token。(token也可以是无序的乱码)
- Must be used with TLS
- header + payload + signature
- API Key [+ Signature]
- OAuth (Open Authorisation) Protocol - strictly uses HTTP protocol elements only
Week 6 part 2 data analysis
就是简单叙述了machine learning,没啥用。
Week 7: Classification
前几周的都是理论也都学过很多次了,没什么意思,就从week7的machine learning重新看起
Machine learning for data analytics
其实就是在剩余的时间我们会学点啥,就是把前几周的知识结合在一起了。。。会用到pandas,flask和machine learning等。
- Define and Initialize a Model
- Train your Model (using your training dataset)
- Validate the Model (by prediction using your test dataset)
- Use it: Explore or Deploy as a web service
- Update and Revalidate
Supervised Learning
大家这个在9417或者别的ai课应该都有学过这些简单的理论的。
Assume: y=f(x)
Classification: y is discrete (class labels).
Regression: y is continuous, e.g. linear regression.
Classification
- Supervised learning
- Need the data labeled with correct answer
- Trained classifiers then can map input data to a category
常用的分类算法就是KNN
KNN (k-Nearest Neighbour)
It is a non parametric and instance-based learning algorithm
Non-parametric means it makes no explicit assumptions about the functional form of how the prediction is made, avoiding the dangers of mismodeling the underlying distribution of the data.
Instance-based learning means that our algorithm doesn’t explicitly learn a model. Instead, it chooses to memorize the training instances which are subsequently used as “knowledge” for the prediction phase. Concretely, this means that only when a query to our database is made (i.e. when we ask it to predict a label given an input), will the algorithm use the training instances to spit out an answer.
学校给的算法思路:
k- Nearest Neighbour Classifier Algorithm Give a training set X_train(数据) with lables y_train(结果) and given a new instance x_test to be classified:
- Find the most similar instances (let’s call then X_NN) to x_test that are in X_train.
- Get the labels y_NN for the instances in X_NN.
- Predict the label for x_test by combining the labels y_NN (e.g., using majority rule)
KNN是通过测量不同特征值之间的距离进行分类。如果一个样本在特征空间中的k个醉相思的样本中的大多数属于某一类别,则该样本也属于这个类别。其中k通常不大于20。knn计算距离的公式一般是用欧几里得或者曼哈顿距离:
$$
欧几里得距离: d(x, y) = \sqrt{\sum_{k=1}^{n}(x_{k}-y_{k})^2}\
曼哈顿距离: d(x, y) = \sqrt{\sum_{k=1}^{n}|x_{k}-y_{k}|}\
$$
算法的思路:
- 计算测试数据与各个训练数据之间的距离
- 按照距离来排序
- 选取距离最小的k个点
- 确定前k个点所在类别的出现频率
- 返回前k个点钟出现频率最高的类别作为测试数据的预测分类
在github上找了一个例子给大家看下:
1 | import pandas as pd |
就直接把数据拆分为test和train两个集合,然后进行训练,训练完之后对比结果,knn.score是输出准确性。想看源码的可以直接在网上搜索,很多实现的源码。
How to choose k
k值如果过大可能会导致更好的性能,但是同时也会倒是找到的数据不是neighbor。通常k的取值为:$$k<\sqrt{n}$$ 其中n是训练数据的数量。
Generalization, Overfitting and Underfitting
泛化,过度拟合和不足拟合
- Generalization ability refers to an algorithm’s ability to give accurate predictions for new, previously unseen data.
- Models that are too complex for the amount of training data available are said to overfit and are not likely to generalize well to new data instances. (数据太复杂,导致过度拟合)
- Models that are too simple, that do not even do well on the training data, are said to underfit and also not likely to generalize well. (数据太简单,导致拟合不足)
When to use Nearest Neighbor
When to Consider:
- Instance map to points in Rn
- Less than 20 attributes per instance
- Lots of training data
Advantages
- Training is very fast
- Learn complex target functions
- Do not lose information
Disadvantages
- Slow at query
- Easily fooled by irrelevant attributes
- The Bigger the dataset the more impact on performance
Nearest neighbors sensitive to mis-labeled data (“class noise”). Solution?
Smooth by having k nearest neighbors vote
nn算法需要对数据进行一个简单的清洗池,然后选择适当的k值可以提高准确率
Complexity
Expensive at test time: To find one nearest neighbor of a query point x, we must compute the distance to all N training examples. Complexity: O(kdN) for kNN
- Use subset of dimensions
- Compute only an approximate distance (e.g., LSH)
- Remove redundant data (e.g., condensing)
Storage Requirements: Must store all training data
- Remove redundant data (e.g., condensing)
- Pre-sorting often increases the storage requirements
High Dimensional Data: “Curse of Dimensionality”
- Required amount of training data increases exponentially with dimension
- Computational cost also increases
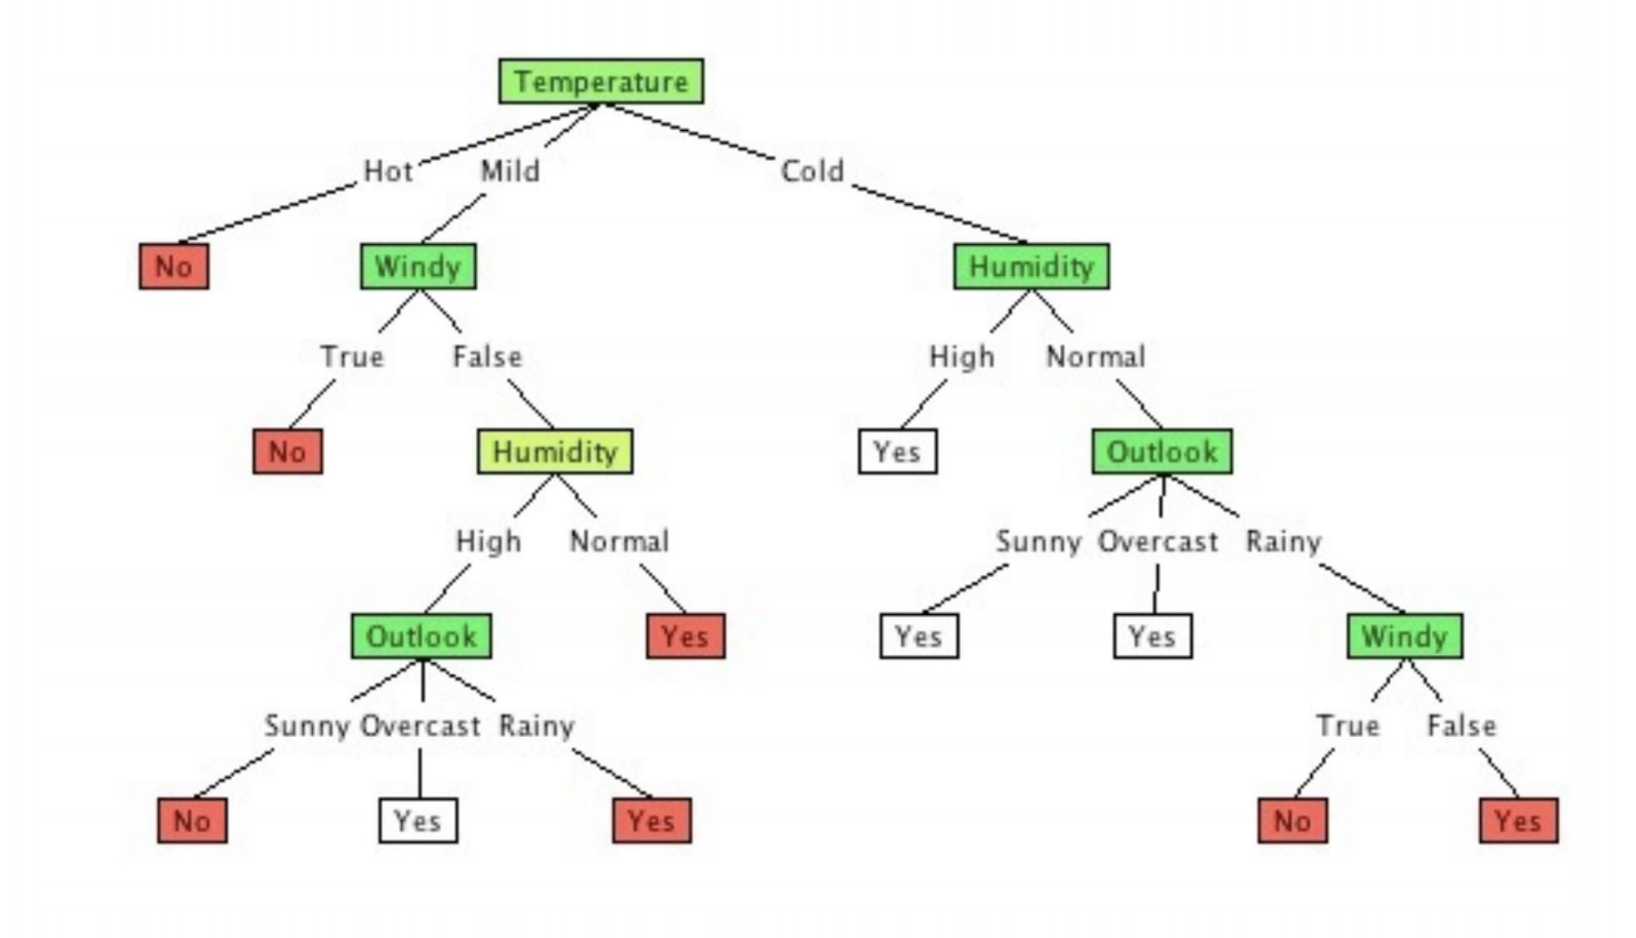
Decision Tree
决策树既可以做分类,又可以做回归。决策树常见的算法:ID3(贪心算法),C4.5(贪心算法)与C5.0生成树算法用熵(entropy)。
决策树的好处:
- Handling of categorical variables
- Handling of missing values and unknown labels
- Detection of nonlinear relationships
- Visualization and interpretation in decision trees
When to consider Decision Trees
- Instances describable by attribute-value pairs
- Target function is discrete valued
- Disjunctive hypothesis may be required
- Possibly noisy training data
- Missing attribute values
Examples:
- Medical diagnosis
- Credit risk analysis
- Object classification for robot manipulator (Tan 1993)
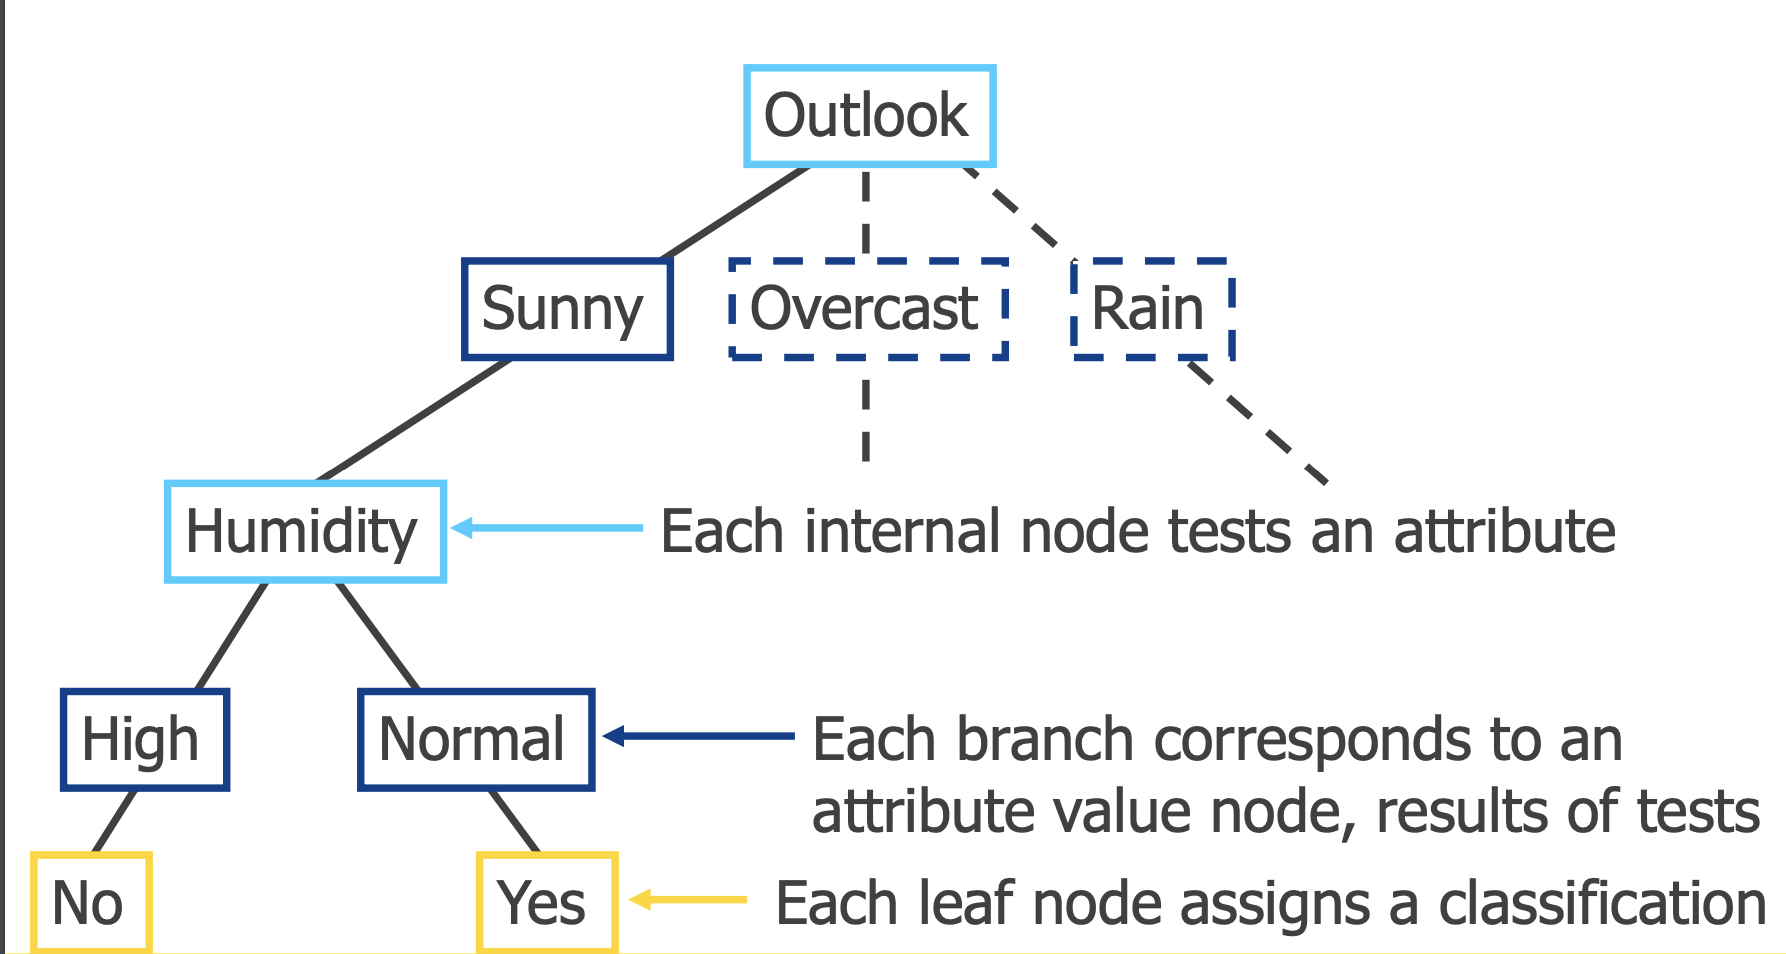
A decision tree has 2 kinds of nodes
- Each leaf node has a class label, determined by majority vote of training examples reaching that leaf.
- Each internal node is a question on features. It branches out according to the answers.
Diagram of decision tree
首先了解一下典型的算法ID3:
期望信息越小,信息增益越大。熵(entropy):
$$
info(D) = -\sum_{i=1}^{m}p_{i}log_{2}(p_{i})
$$
现在我们假设将训练元组D按属性A进行划分,则A对D划分的期望信息为:
$$
info_{A}(D) = \sum_{j=1}^{v}\frac{|D_{j}|}{|D|}info(D_{j})\
gain(A) = info(D)-info_{A}(D)
$$
Avoid Overfitting
避免过度拟合的方法:
- Stop growing the tree when the error doesn’t drop by more than a threshold with any new cut.
- Prune a large tree from the leaves to the root. Weakest link pruning:
Week 8 Linear regression
Linear regression 是supervised ML。regression包含了simple linear regression,multiple linear regression,polynomial linear。线性回归的公式:$y=f(x)$
$$
y = ß + \sum_{j=1}^{p}x_{j}ß_{j}
$$
其中ß是regression model。
什么时候使用linear regression:
- 变量是连续的
- feature和target是线性关系
- 特征之间很少或没有多重共线性。
- 错误项的正态分布。
- 最小异常值
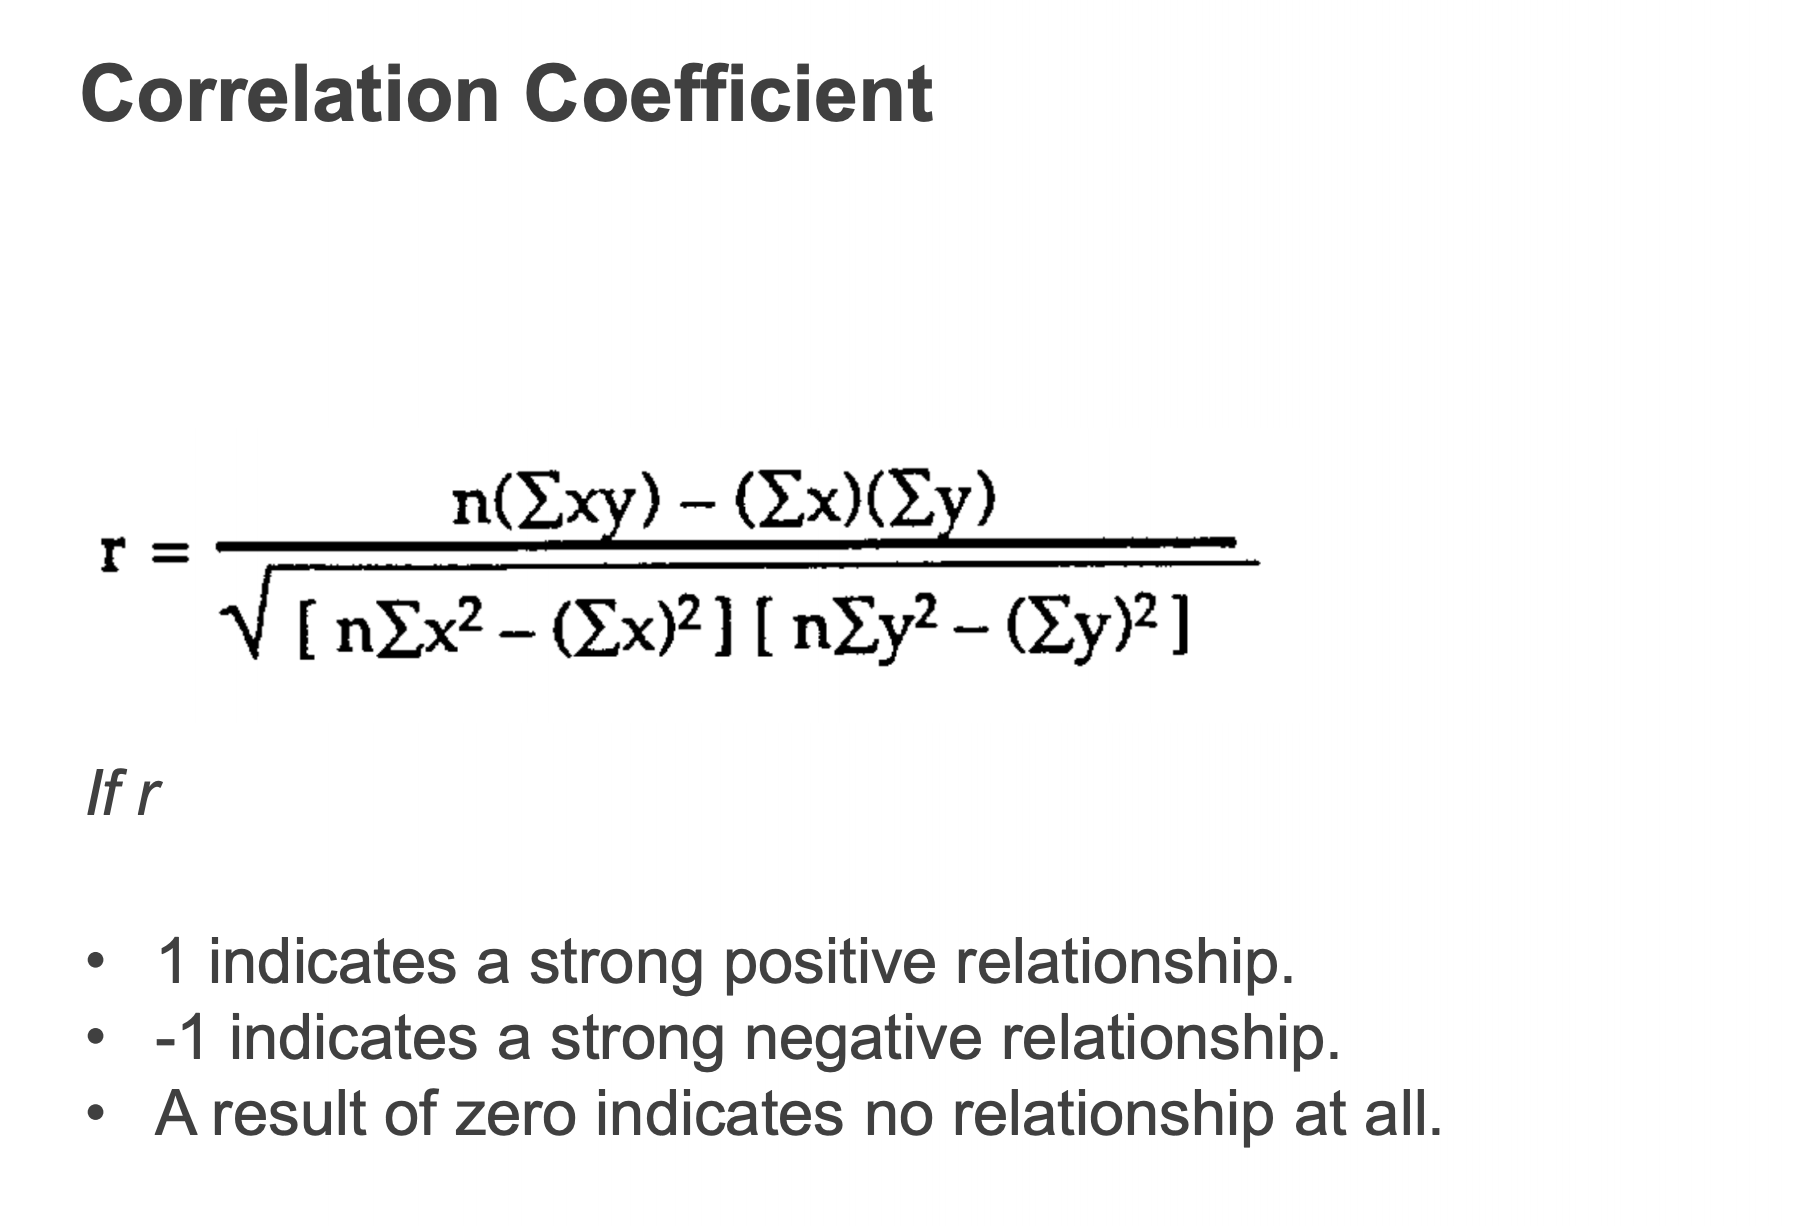
前两个才是主要的。可以通过画图,或者计算coefficients来验证是否符合linear regression。
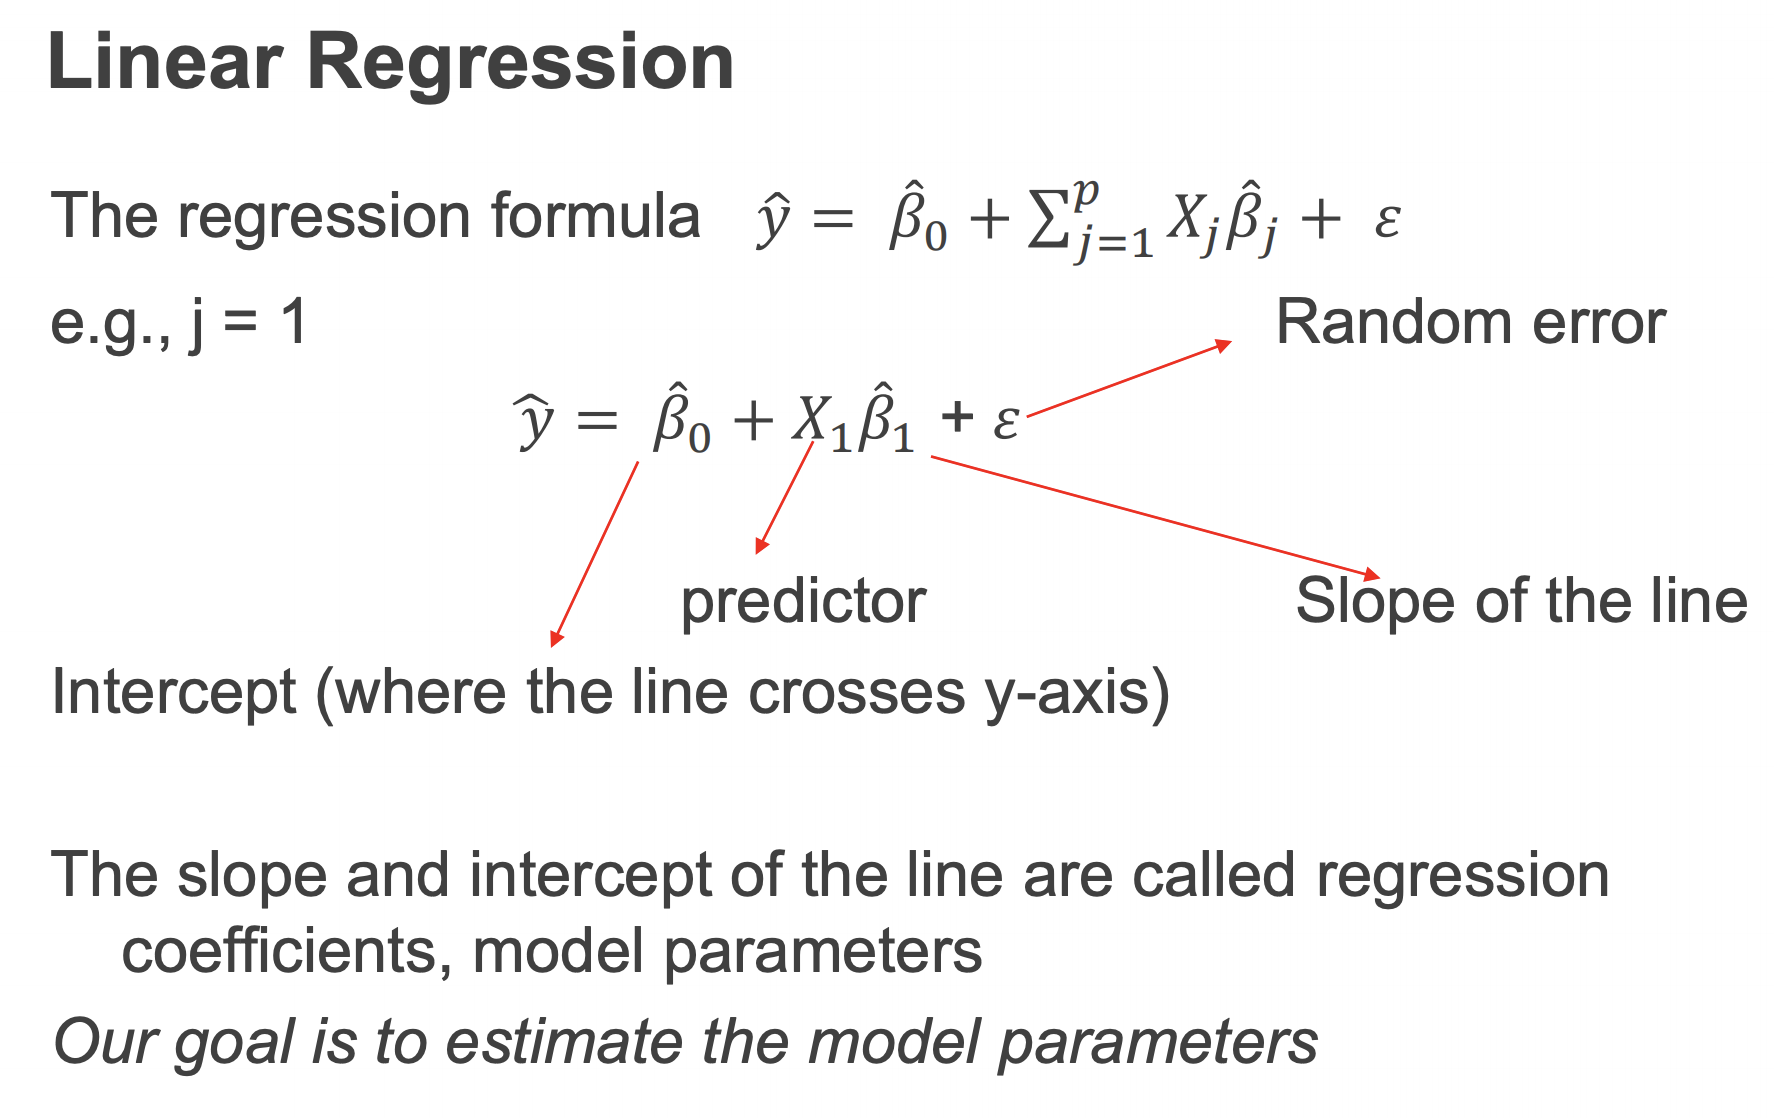
Simple linear regression VS multiple linear regression
*Linear regression: * $y=b_{0}+b_{1}X_{1}+∂$
MLR:$y=b_{0}+b_{1}X_{1}+b_{2}X_{2}+∂$
Week 8 Clustering
聚类算法的两种方式:flat algorithm(平面算法),Hierarchical algorithms(分层算法)。
Hard clustering: Each example belongs to exactly one cluster
Soft clustering: An example can belong to more than one cluster (probabilistic)
K means:
- Start with some initial cluster centers (k random points) (也就是分类的数量)
- Iterate
- Assign/cluster each example to closest center
- iterate over each point:
- get distance to each cluster center
- assign to closest center (hard cluster)
- iterate over each point:
- Recalculate and change centers as the mean of the points in the cluster.
- Assign/cluster each example to closest center
- Stop when no pointsʼ assignments change
K-Means算法的特点是类别的个数是人为给定的,(但是K是随机的)重要的假设是:数据之间的相似度可以使用欧氏距离度量。
核心思路:
确定类别个数,随机生成cluster center(因为是聚类算法,所以随机更加分布),这样每个点都会有一个中心,但是这个时候聚类可能不会特别准确:
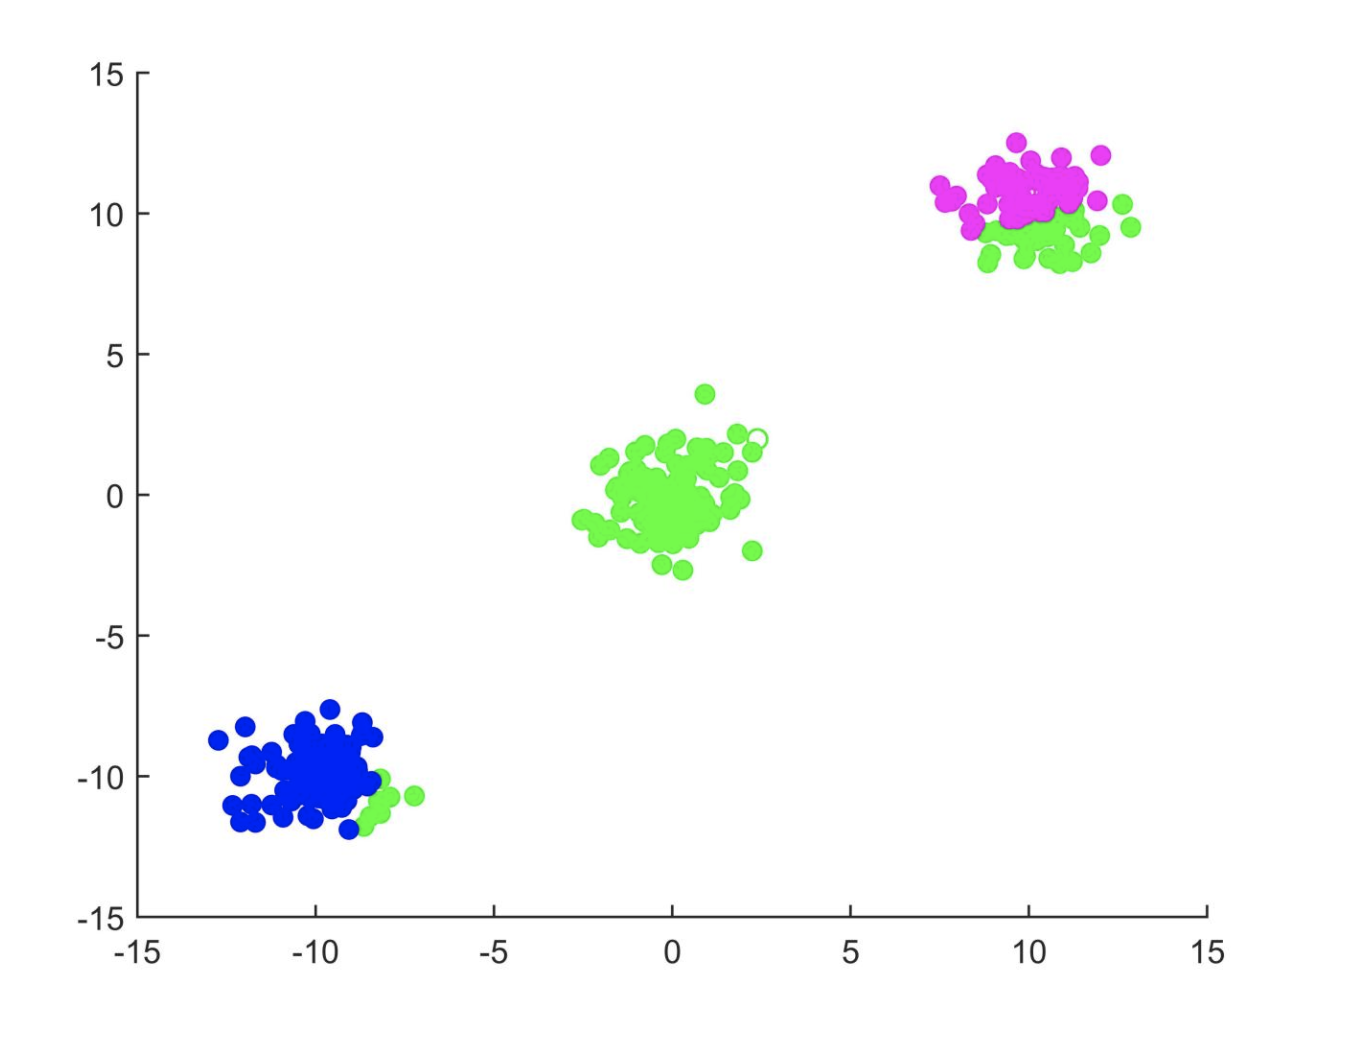
所以这时候需要不断的调整中心点的距离,去(同化)附近一些点。可以根据这一堆点的中心点调整,(或者说坐标平均值)。
K-Means 一般是用欧式距离